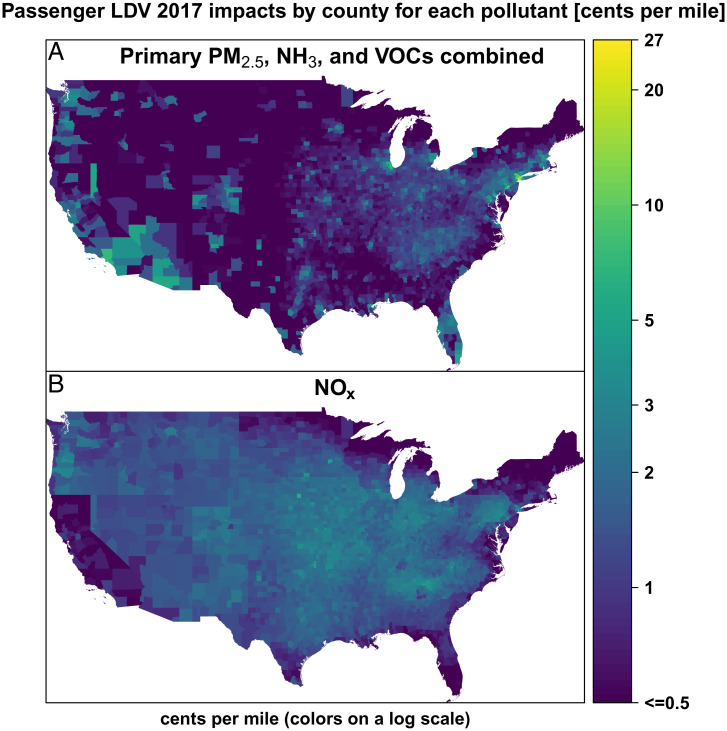
Fig. 4.
Impacts per mile by county for passenger LDVs. SO2 impacts are not shown since it represents just 0.9% of their overall impacts. A shows the combined impacts of emissions of primary PM2.5, NH3, and VOCs. B shows the impact of NOx emissions. Although impacts per mile can be as low as 0.01 cent/mile, no differentiation for values smaller than 0.5 is shown. US County Boundaries from US Census Bureau (30).

