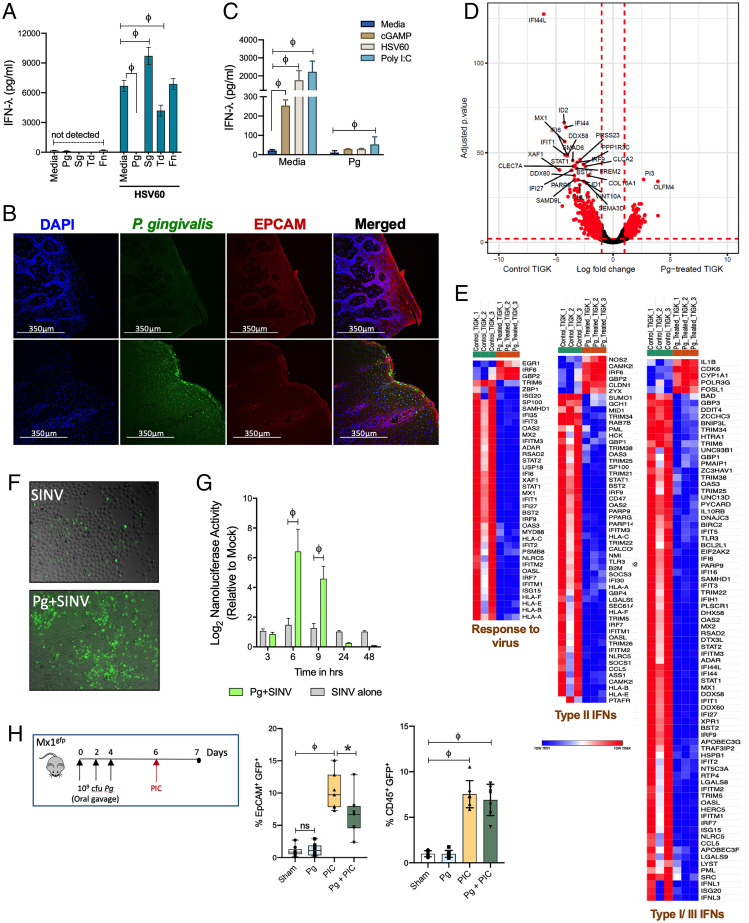
Fig. 2.
P. gingivalis infection causes IFN paralysis, characterized by the loss of basal and inducible IFN responses and ISG expression. (A) IFN-λ responses were measured by ELISA in TIGKs challenged either with P. gingivalis (Pg), T. denticola (Td), or F. nucleatum (Fn) at MOI 100 or S. gordonii (Sg) MOI 10 for 5 h, washed once with PBS, and then stimulated with 5 μg/mL HSV60 for additional 18 h. (B) P. gingivalis colonization was determined in gingival tissues by immunofluorescence staining. (C) TIGKs were either left untreated or infected with P. gingivalis (Pg) as described above with subsequent stimulation with 50 μg/mL poly I:C (TLR3 agonist), 5 μg/mL ORN06 (TLR7 agonist), 5 μg/mL HSV60, or 25 μg/mL 2’3′-cGAMP (STING agonist) for 18 h. IFN-λ levels in cell-free supernatants are shown as mean ± SD. Statistical differences were determined by two-way ANOVA (**P < 0.01; ϕP < 0.001). (D) Volcano plot of differentially expressed transcripts between GECs infected with P. gingivalis (MOI 100) and uninfected control cells. X-axis shows log-fold change between the two conditions, with positive values showing up-regulation and negative values showing down-regulated genes. Y-axis denotes P values for corresponding genes. Significantly different genes are shown highlighted in red (P < 0.001 as determined using the DESeq package in R). (E) Gene enrichment analysis of top 300 down-regulated genes was performed as described in Materials and Methods, and hierarchical clustering heatmaps (based on RPKM values) for response to virus pathway, Type II IFNs, and Type I/III IFNs pathways are shown. Color intensity denotes level of gene expression. (F) Viral growth/dissemination was measured in mock and Pg-treated GECs infected with SINV nsP3-GFP strain at an MOI of 10 PFU per cell and cultured under normal conditions for a period of 24 h prior to GFP and brightfield microscopic imaging. Data shown are representative of three independent biological replicates. (G) Viral gene expression was assessed in mock and P. gingivalis–treated GECs infected with SINV nsP3-Nanoluc at an MOI of 10 PFU per cell and cultured in the presence of ammonium chloride to limit infection to the initial single-round entry event. At the indicated time points, the cells were harvested and the level of Nanoluc activity was assayed. Statistical differences were determined by two-way ANOVA (**P < 0.01; ϕP < 0.001). (H) Mx1gfp mice were colonized by P. gingivalis before intraperitoneal (i.p.) challenge with poly I: C. GECs (EpCAM+, CD45−) and leukocytes (EpCAM−, CD45+) were analyzed by flow cytometry, and %GFP-positive cells (mean ± SD) determined by flow cytometry. Each data point represents one mouse (n = 7 to 5 per group). Statistical differences determined by one-way ANOVA (*P < 0.05; **P < 0.01).

