Fig. 3.
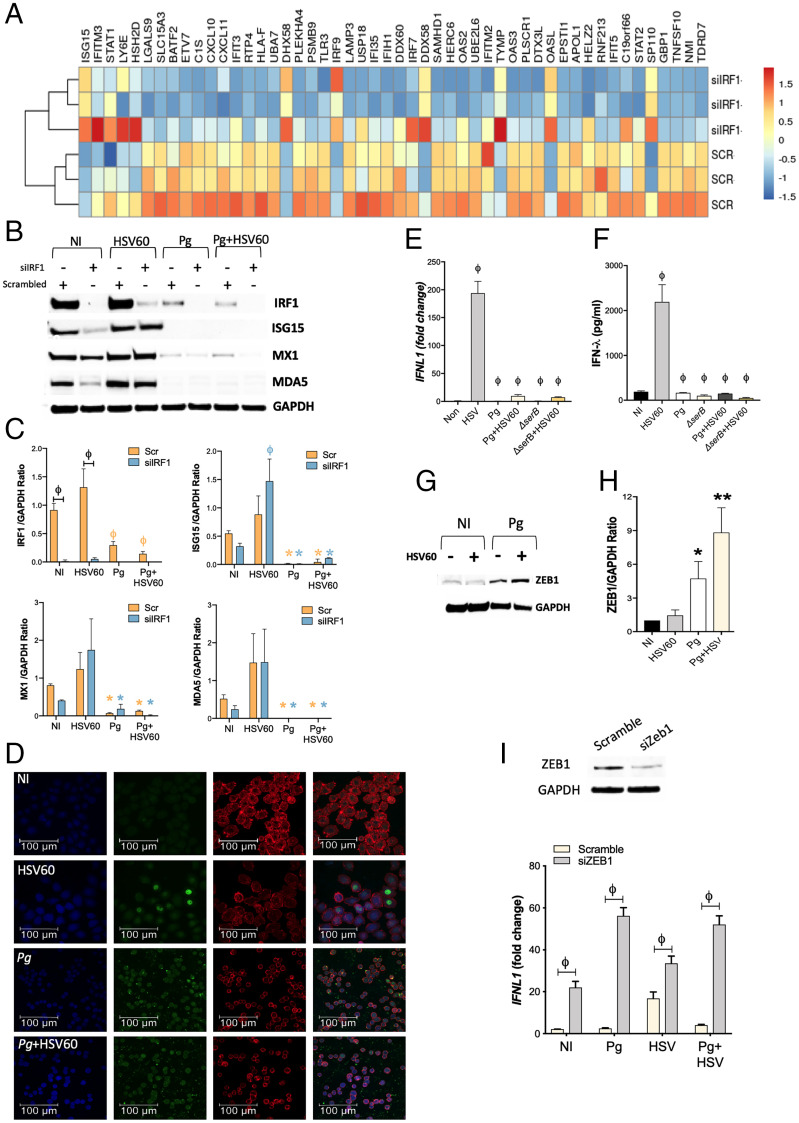
P. gingivalis incapacitates transcription factors that positively regulate IFN-λ expression, and up-regulates ZEB1, a transcriptional repressor of IFN-λ. (A) TIGKs were transfected with siIRF1 or scrambled control siRNA and differentially expressed transcripts determined by RNA-seq. Hierarchical clustering heat map (based on log RPKM values) of the top 50 ISGs differentially expressed on IRF-1 silencing. Color intensity denotes level of expression. (B) TIGKs were transfected with siIRF1 (si) or scrambled control siRNA (scr) and infected with P. gingivalis (Pg) or stimulated with 5 μg/mL HSV60 and immunoblotted for IRF-1, ISG15, MX1, MDA5, and GAPDH. (C) Band intensities of immunoblots were determined, and ratios of IRF1, ISG15, MX1, and MDA5 normalized to GAPDH from three different blots are shown (mean ± SD). Statistical differences were determined by two-way ANOVA (ϕP < 0.001; *P < 0.05). Orange and blue symbols depict comparisons between NI (not infected) scr control and siIRF1, respectively. (D) TIGKs were infected with P. gingivalis and/or stimulated with 5 μg/mL HSV60, labeled with anti–IRF-1 antibodies (green), and analyzed by confocal microscopy. Actin was labeled with phalloidin (red) and nuclei stained with DAPI (blue). Merged images are shown on the Right. Magnification (63×) of 20 z-stacks of 0.3 μm. TIGKs were infected with P. gingivalis WT (Pg) or SerB-deficient isogenic mutant (ΔserB) for 5 h, followed by 5 μg/mL HSV60 for additional 18 h. (E) Transcript levels of IFNL1 determined by qRT-PCR, normalized to GADPH (2-ΔΔCT) and are shown as mean ± SD; (F) secreted IFN-λ in cell-free supernatants determined by ELISA and shown as mean ± SD. (G) ZEB1 and GAPDH were detected by immunoblotting. (H) Band intensities were determined, and ratios of ZEB1 to GAPDH from three different blots are shown (mean ± SD). (I) GECs were transfected with siZEB1 or scrambled control siRNA. After 48 h, media was replaced, and cells were challenged with P. gingivalis (MOI 100) for 5 h and then stimulated with 5 μg/mL HSV60 for 16 h. Transcript levels of IFNL1 were determined by qRT-PCR normalized to GADPH (2-ΔΔCT) and are shown as mean ± SD. Statistical differences were determined by two-way ANOVA (ϕP < 0.001).

