Fig. 2.
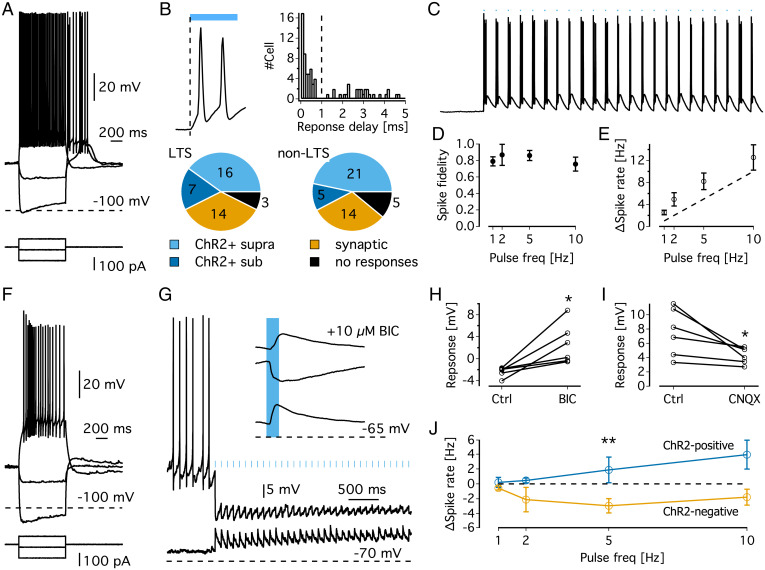
Single-cell recordings in acute brain slices of GAD2LPO mice. (A) Representative electrophysiological characteristics of an LTS neuron in the preoptic area. (B) (Top left) Example of a membrane potential (Vm) response to ChR2 activation in a putative ChR2-positive cell (magnification of the trace shown in panel C). Note that depolarization starts immediately upon the onset of illumination. (Top right) Histogram of delays between optical stimulation and Vm response showing a bimodal distribution; responses with delay <1 ms were classified as ChR2+, with delays >1 ms classified as synaptic responses. (Bottom) Classification of cells according to ChR2 response properties. (C) Example trace of a putative ChR2-positive cell responding to 10 Hz stimulation. (D) Spike fidelity of putative ChR2-positive neurons represented as the proportion of light pulses followed by a spike. (E) Relationship between stimulation frequency and mean spike rate during stimulation in putative ChR2-positive neurons. (F) Representative electrophysiological characteristics of a non-LTS neuron in the preoptic area. (G) Representative traces and average evoked potentials (Top right) of a ChR2-negative neuron, exhibiting depolarizing light responses at −70 mV (bottom trace and bottom average evoked potential) and hyperpolarizing responses at a slightly depolarized Vm (upper trace and middle in average evoked responses). The top average evoked potential shows the light response at a depolarized membrane potential in the presence of bicuculline. Note the unmasking of excitatory responses. (H) Change in average evoked responses (at depolarized Vm) in response to blocking of ionotropic GABA receptors with bicuculline. *P = 0.02, t = 3.34, paired t test. (I) Change in average evoked responses (at resting Vm) in response to blockage of ionotropic glutamate receptors with CNQX. *P = 0.04, t = −2.78, paired t test. (J) Changes in spontaneous spike rates (induced by injection of depolarizing currents) during 2 min of optical stimulation at 1, 2, 5, and 10 Hz. ** represents significant increase in spike rate in ChR2 group [F(1,53) = 9.46, P = 0.003] but no significant effect of stimulation frequency [F(3,53) = 0.74, P = 0.53) or interaction [F(3,53) = 1.13, P = 0.35; two-way ANOVA]. BIC, bicuculline.

