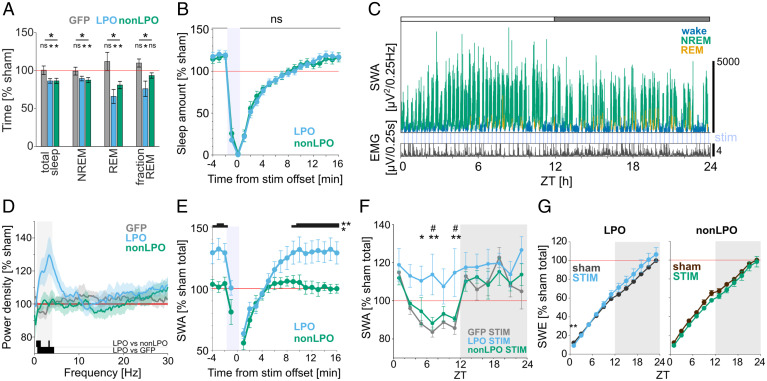
Fig. 4.
Photoactivation induces a rebound of SWA during NREM sleep in GAD2LPO but not in GAD2nonLPO animals. (A) The effect of photostimulation on the total amount of vigilance states during the light period, shown as the percentage change relative to sham stimulation day. Stars above the lines indicate significant differences in RM-ANOVA, and stars and ns above plots indicate significance in t tests against 100%. *P < 0.05; ns, nonsignificant. Mean values ± SEM. (B) Amount of sleep during the 20-min window aligned to stimulation offset shown as percentage relative to the average sleep amount during sham stimulation day. All trials occurring during the light period are averaged for LPO and non-LPO animals. No significant difference was observed in sleep amount between the two groups using a two-way ANOVA (P > 0.1) and a post hoc uncorrected Fisher’s LSD test. Mean values ± SEM. (C) Representative 24-h profile of EEG SWA and EMG in one individual animal that received stimulation to the LPO. SWA is plotted in 4-s resolution and is color coded according to vigilance state (green, NREM; blue, wake; yellow, REM). Note the progressive increase in SWA across the 12-h light period (indicated as a white bar on the top). (D) Relative EEG power density in NREM sleep shown for the 10-Hz 24-h stimulation condition during the light period compared to sham condition. Mean values ± SEM. Black bars at the bottom of the figure denote frequency bins in which the difference between experimental groups was significant (P < 0.05, unpaired t tests). Shaded area denotes the SWA frequency range (0.5 to 4 Hz). (E) Time course of EEG SWA over a 20-min window aligned to stimulation offset (time 0) during the light period. SWA is shown as a percentage of sham stimulation day SWA during the light period. *P < 0.05, **P < 0.01, post hoc uncorrected Fisher’s LSD test following RM-ANOVA. Mean values ± SEM. (F) Time course of EEG SWA during NREM sleep across 24 h on the day with photostimulation. SWA is plotted in 2-h intervals and represented as percentage of average NREM SWA during sham stimulation day (mean values ± SEM; *or #P < 0.05, **P < 0.01, Tukey’s multiple comparisons test after RM-ANOVA). *LPO versus GFP; #LPO versus non-LPO. (G) Cumulative EEG SWE across 24 h. Stars above plots indicate significance in multiple paired t tests. **P < 0.01. Comparison on the slope of SWE in the light period between LPO and non-LPO is shown in SI Appendix, Fig. S5D. Mean values ± SEM. No. of animals in A: LPO, n = 8; non-LPO, n = 6; GFP, n = 8. No. of animals in D–F: LPO, n = 8; non-LPO, n = 6; GFP, n = 7.

