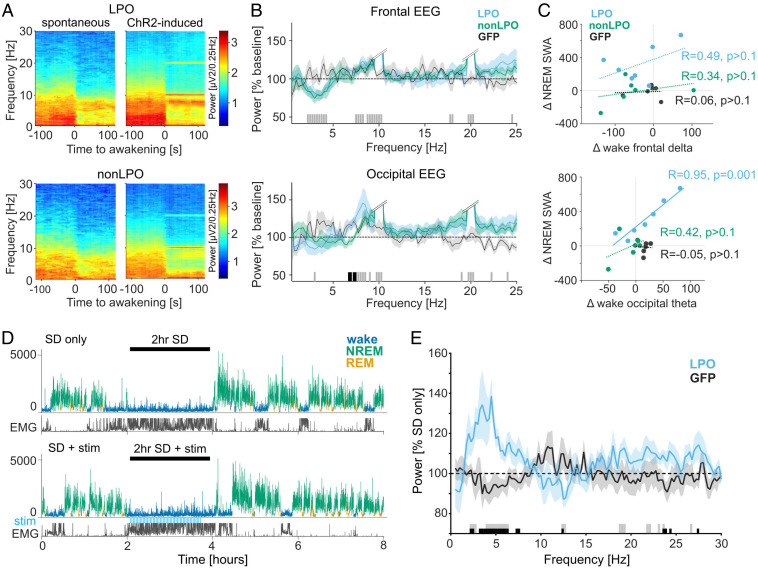
Fig. 5.
Effects of LPO and non-LPO photoactivation on wakefulness and subsequent sleep. (A) Average wake-EEG spectrograms recorded from the occipital derivation of representative mice during spontaneous awakenings on a baseline day and during awakenings induced by photoactivation (Top: LPO, Bottom: non-LPO). Time 0 corresponds to the onset of waking. Color scale: spectral power in common logarithm values. (B) Average EEG spectral power density during photoactivation-induced awakenings expressed as a percentage of power during spontaneous awakenings during baseline. Bars at the bottom indicate significant differences (P < 0.05) in post hoc rank-sum tests following general linear mixed model; black, significant differences between LPO and non-LPO groups; gray, no significant differences between LPO and non-LPO groups but LPO and non-LPO groups combined are significantly different from 100%. Double slash: the cutoff for stimulation-induced artifacts at around 10 Hz and 20 Hz, from the frequency with steep increase in power, until the frequency with steep decrease. (C) Correlation between stimulation-associated differences in wake SWA and NREM SWA (Top) and in wake theta-frequency (6 to 9 Hz) power and NREM SWA (Bottom). R: Pearson’s correlation coefficients, with corresponding P values. Note that only the correlation between wake theta-frequency power and NREM SWA in LPO group is statistically significant. (D) Representative hypnograms illustrating the experimental design for stimulation during SD. (Top) 2-h SD without stimulation (SD only). (Bottom) 2-h SD combined with photostimulation, shown as blue bars “stim.” SWA plotted for 4-s epochs is color coded according to the state of vigilance. y axis in μV2/0.25 Hz. (E) Effect of stimulation during wakefulness on EEG spectra during subsequent NREM sleep. The EEG power after SD + stim is calculated over the first 2 h of recovery sleep and represented as percent of “SD only” condition in the LPO and GFP animals. Bars at the bottom denote frequency bins in which the EEG power was significantly affected by stimulation (P < 0.05, t test); black, significant between GFP and LPO; gray, significant against 100% in LPO. No. of animals used in B and C: LPO, n = 7; non-LPO, n = 6; GFP, n = 6. No. of animals used in D and E: LPO, n = 6; GFP, n = 7.

