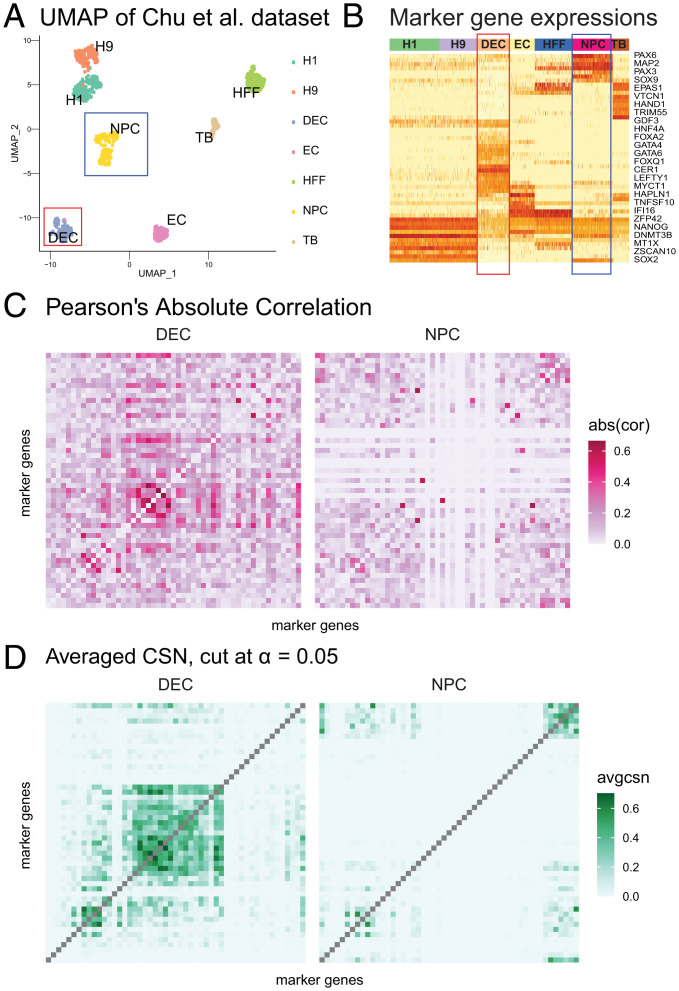
Fig. 2.
Estimated networks for Chu et al. (18) cells. (A) UMAP of Chu et al. cells, colored by cell types. The red and blue boxes indicate selected cell type: DEC and NPC. (B) Heatmap of gene expression for 57 developmental genes for seven cell types. High to low expression corresponds to red to light yellow in the heatmap. Seven cell types are color coded by the band on the top of the heatmap. The red and blue boxes indicate DEC and NPC cell types. (C) Heatmaps of absolute Pearson’s correlation for DEC and NPC cell types, calculated independently within cell types. The order of genes is the same as B. (D) Heatmaps of averaged locCSN for DEC and NPC cell types, thresholded at Gaussian distribution quantile. The order of genes is the same as B.

