Fig. 3.
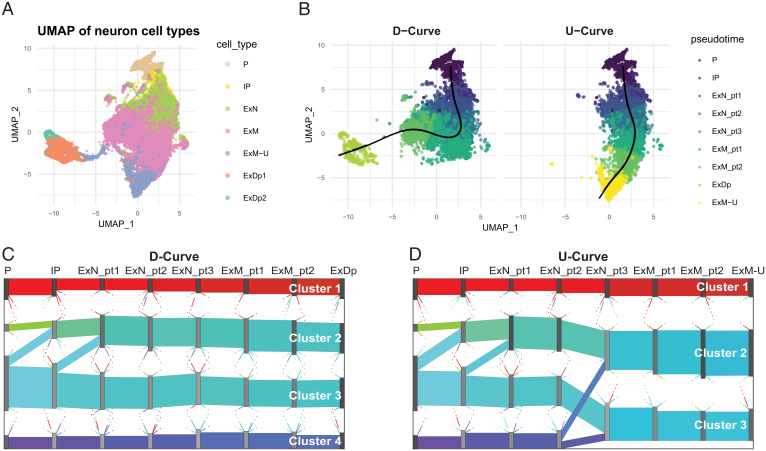
Development of networks in human fetal brain cells. (A) UMAP of human fetal brain single-cell expression from seven cell types involved in development of excitatory neuron cells, (B) with developmental trajectories superimposed. The UMAP plots indicate metacells, whose coordinates are the average UMAP cellular locations. The two principal curves are generated by Slingshot (19). Colors are determined by the metacell’s pseudotime and cell types for the two curves, which are calculated as the average pseudotime over all cells in the metacell. Left and Right show the metacells’ assignment, based on pseudotime, to D curve and U curve, respectively. (C and D) Sankey plots of averaged CSN for eight bins in D curve and U curve. Gene flows are shown as colored bands connecting two adjacent pseudotime bins for (C) D curve and (D) U curve. The color of each band is the mixture of colors assigned to its constituent genes, so that flows with similar gene compositions are assigned similar colors.

