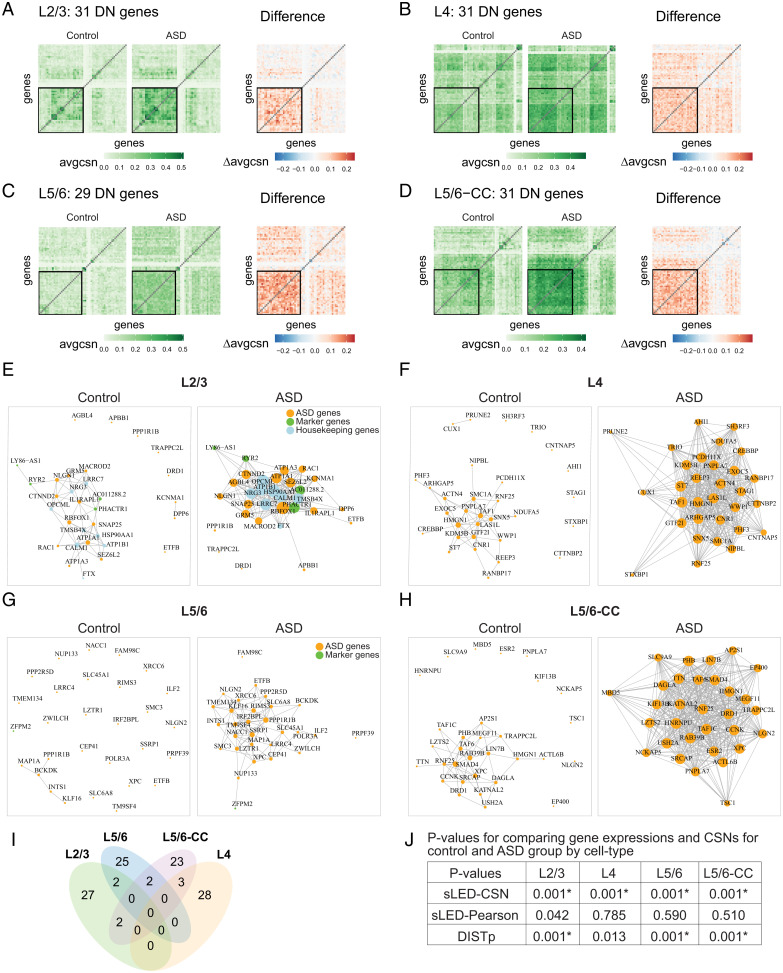
Fig. 4.
CSN analysis results for ASD Brain dataset. (A–D) Heatmaps of average CSNs and the average difference (ASD minus control). Heatmaps display sLED-CSN selected DN genes for each cell type, contrasted with an additional 30 randomly selected genes from 1,123 genes, including 942 ASD genes, 104 marker genes, and 77 housekeeping genes. The black squares delineate the DN genes for each cell type: (A) L2/3, (B) L4, (C) L5/6, and (D) L5/6-CC. (E–H) Gene networks for DN genes in the excitatory neuron layers. The networks are generated from averaged CSN of control and ASD groups. (E) L2/3, (F) L4, (G) L5/6, and (H) L5/6-CC. (I and J) Contrasting differentially expressed and DN genes for ASD vs. controls. (I) Venn diagram of all DN genes for neuron layer cell types. (J) P values for comparing gene expressions and CSNs for control and ASD groups by cell types. Comparing gene expressions and CSNs for control and ASD groups, P values are calculated by sLED–CSN, sLED–Pearson, and DISTp for four excitatory neuron layers: L2/3, L4, L5/6, and L5/6-CC. Asterisk (*) indicates significant differences between two groups after adjusting for multiple testing with 13 cell types.

