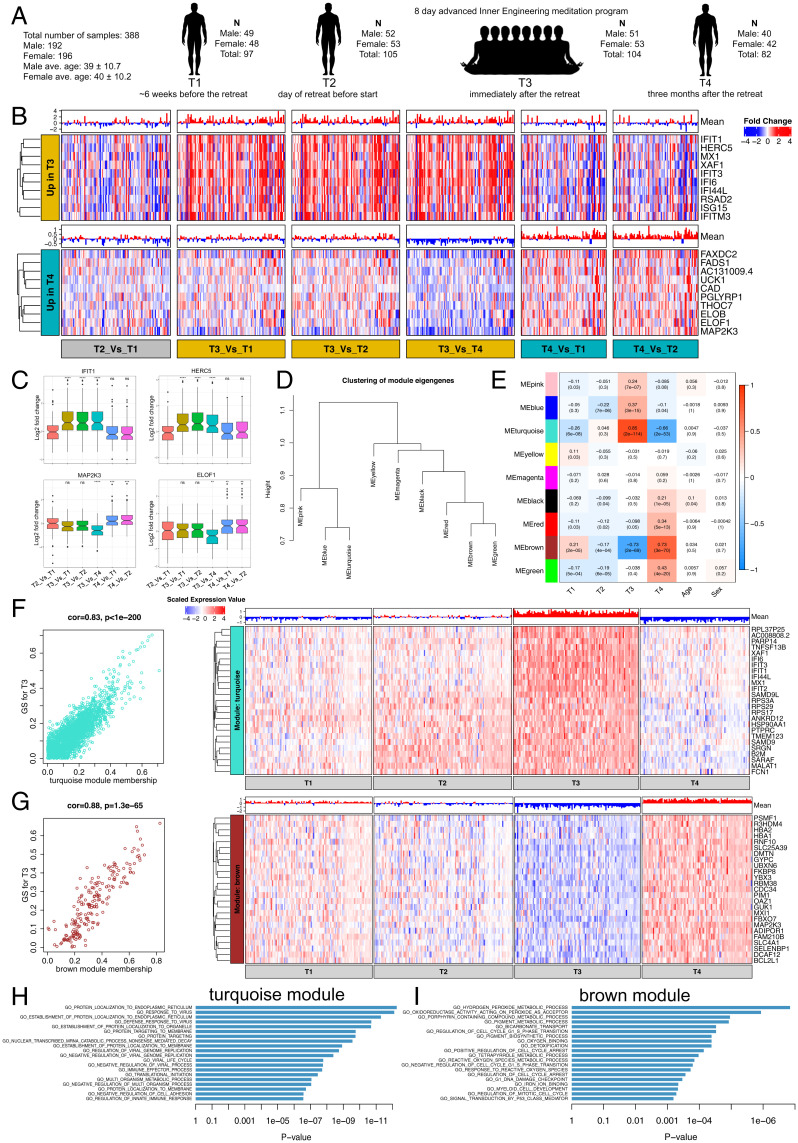
Fig. 1.
Coexpression network analysis of whole-blood transcriptome profile changes after meditation. (A) Longitudinal blood collection at four time points (T1 to T4) from advanced Inner Engineering meditation program participants. (B) Heatmaps are depicting the expression of the top ten genes (rows) across samples (columns) for six different time point comparisons (red corresponds to gene up-regulation and blue to down-regulation). Mean gene expression levels are shown as a bar plot. (Top and Bottom) The top 10 genes up-regulated at T3 (after meditation) and T4 (3 mo after meditation) are shown. (C) Boxplot represents the variability in the expression levels of the top two genes up-regulated at T3 (Top) and T4 (Bottom). (D) Hierarchical clustering of WGCNA module eigengenes. (E) Module-trait associations. Each row corresponds to a module eigengene and column to a trait. Each cell contains the corresponding correlation and P value. Red and blue color denote positive and negative correlation with gene expression, respectively. (F and G) A scatter plot of gene significance (GS) for T3 versus the module membership (MM) in the turquoise (Top) and brown (Bottom) module. Intramodular analysis of the genes found in these two modules contains genes that have a high correlation with meditation, with P < 1.3e−65 and correlation >0.8. Heatmaps are depicting the expression of top 25 hub genes (rows) across samples (columns) for four time points (red corresponds to gene up-regulation and blue to down-regulation) in the turquoise (Top) and brown (Bottom) module. Mean gene expression levels are shown as a bar plot. Hub genes have a high GS and MM value with T3. (H and I) GSEA of gene ontology terms calculated by Fisher's exact test for the turquoise and brown module.

