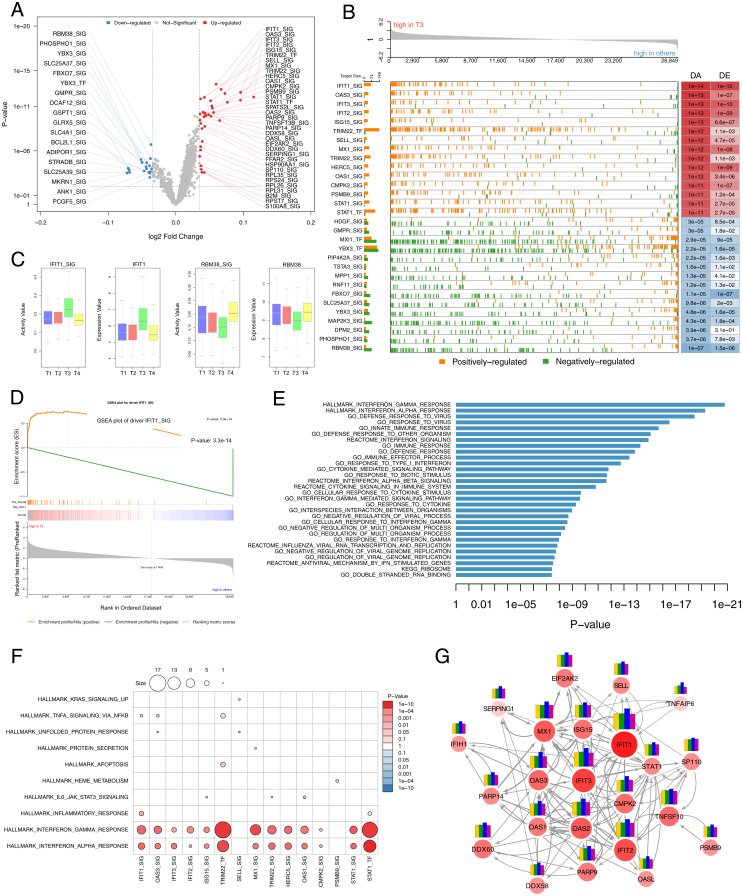
Fig. 2.
Transcriptional regulatory network analyses identify critical signaling pathways and drivers associated with meditation. (A) Volcano plot displaying top drivers [TFs or signaling factors (SIG)] with significant DA in T3 when compared with other time points. The red dots represent the up-regulated drivers; the green dots represent the down-regulated drivers after meditation. (B) GSEA plot shows the significance of top DA drivers with their expression and regulation of their target genes. Positively regulated target genes (orange) of the up-regulated DA drivers (red) tend to have higher fold-change expression values in T3 than other time points. The opposite pattern is observed for the targets regulated by the down-regulated DA drivers (blue). The number of target genes for each driver (Left) and DA and DE values (Right) are shown. (C) Boxplot representation of the variability in the activity (Left) and expression (Right) values of top driver up-regulated (IFIT1) and down-regulated (RBM38) after meditation. (D) GSEA enrichment plot of top driver IFIT1 shows significant enrichment for positively regulated target genes with higher fold-change expression values in T3 than other time points. (E) Biological function enrichment of top DA drivers. Bar charts show significantly enriched gene sets in the gene MSigDB database for the top drivers. (F) Biological function enrichment of the target genes of top 15 DA drivers against curated hallmark gene sets from MSigDB. (G) Subnetwork of the reverse-engineered meditation-specific regulatory network showing up-regulated DA drivers directly associated with IFN-alpha and gamma response. Nodes correspond to genes and edges to mutual information (MI). Edge size corresponds to MI value. Larger nodes correspond to differential expression (Z-score). Node color represents up-regulation (red) or down-regulation (blue). Bar plot depicting the gene expression levels at different time points (Left to Right; T1 to T4), showing consistent elevation at T3 for all drivers.

