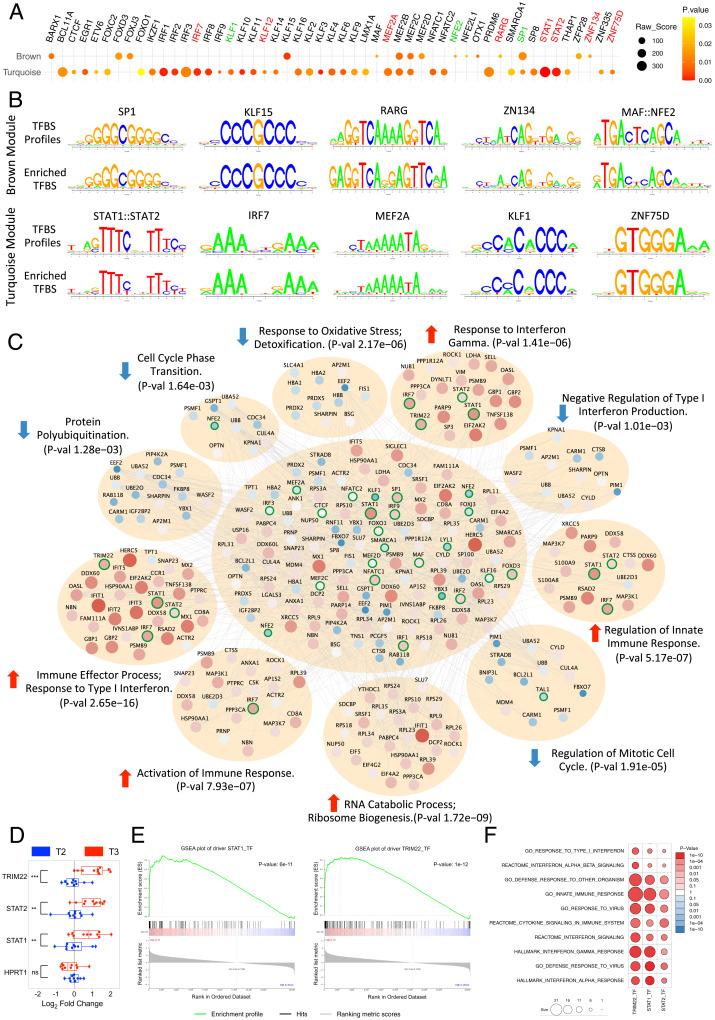
Fig. 3.
TFBS enrichment and convergent pathway analyses. (A) Dot plot showing 51 enriched TFs for the brown (Top) and turquoise (Bottom) module. The dot's size corresponds to the raw enrichment score obtained from the Clover algorithm, and the color of the dot corresponds to enrichment significance. Highlighted names of the over-represented TFs denote their presence in the brown (green) or turquoise (red) module. (B) Sequence logo plots of reference TFBS profiles (JASPAR/HOCOMOCO) and identified position weight matrix for selected TFs significantly over-represented and present in the brown (Top) or turquoise (Bottom) module. (C) PPI network represented by the genes from both turquoise and brown modules along with over-represented TFs and all drivers with significant DA. Significantly enriched functional pathways (corrected P value < 0.05 from Fisher's exact test) in the PPI network are shown. Nodes correspond to genes and edges to PPI. Larger nodes correspond to differential expression (Z-score). Node color represents up-regulation (red) or down-regulation (blue). Nodes with highlighted border (green) correspond to enriched or driver TFs. (D) Quantitative PCR validation of three critical up-regulated TFs after meditation. Boxplot representation of the expression levels of three critical TFs from 10 random individuals for each time point. Expression levels of HPRT1 are shown as endogenous control. Paired t test was performed to calculate the statistical significance (**P ≤ 0.01, ***P ≤ 0.001). (E) GSEA enrichment plot of STAT1 and TRIM22 showing significant enrichment for positively regulated target genes with higher fold-change expression values in T3 compared with other time points. (F) Biological function enrichment of the target genes of STAT1, STAT2, and TRIM22 against curated gene sets from MSigDB showing enrichment for several gene sets related to immune and IFN pathways.

