Fig. 5.
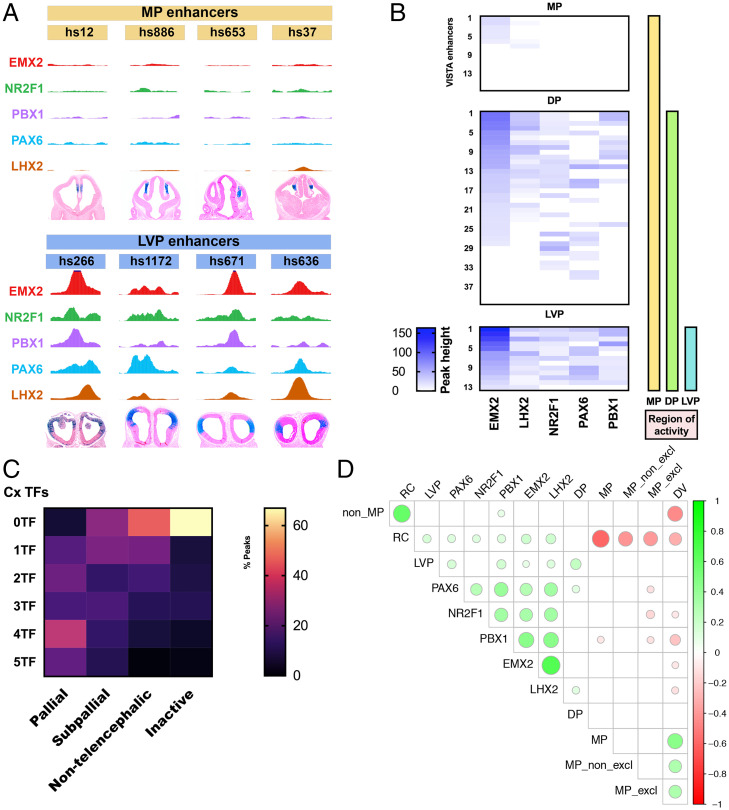
Combinatorial binding of EMX2, LHX2, NR2F1, PAX6, and PBX1 predicts gradients of enhancer activity in the pallium. (A) LVP enhancers (hs266, hs1172, hs671, and hs636) are enriched for ChIP-seq peaks but MP enhancers (hs12, hs886, hs653, and hs37) lack peaks. (B) Heatmap showing enrichment (peak height) of EMX2, LHX2, NR2F1, PAX6, and PBX1 binding over VISTA enhancers with MP exclusive activity (n = 16), MP + DP activity (n = 40), and MP + DP + LVP activity (n = 13) symbolized by the yellow, green, and blue vertical bars. Each row represents a distinct VISTA enhancer and the coverage of TF peaks at that locus. (C) Heatmap of combinatorial TF binding (percentage enrichment; 0 to 5 TFs) on VISTA enhancers that have pallial (n = 55), subpallial (n = 56), nontelencephalic (n = 75), and no activity (inactive; n = 121). (D) Correlalogram of computational modeling showing the different combinations of TF binding and their predictions of gradients of activity (P < 0.01). Green circles indicate correlation, and red circles indicate anticorrelation. The size of the circles is associated with the strength of the correlation/anti-correlation. For instance, RC enhancer activity is correlated with PAX6, NR2F1, PBX1, EMX2, and LHX2 TF ChIP-Seq.

