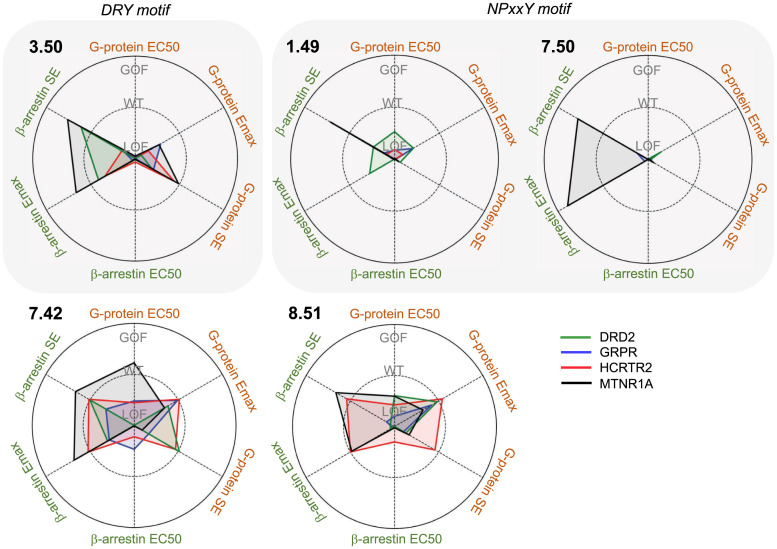
Fig. 6.
Summary of mutation profiles at each position. The axes show fold change of measured parameters EC50, Emax, and surface expression (SE), relative to WT (Mut/WT), annotating WT = 1, GOF > 1, and LOF < 1 on the graphs. Values that are closer to the origin represent more severe loss of function (LOF), while values toward the outermost ring indicate more gain of function (GOF).

