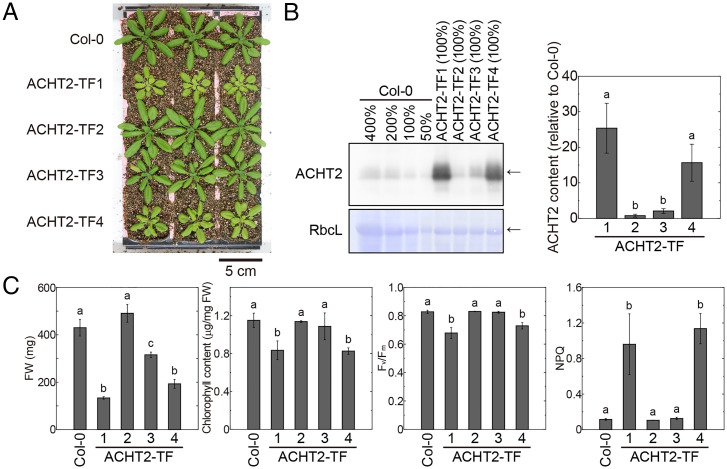
Fig. 5.
Phenotypes of plants with various expression levels of ACHT2. (A) Visible phenotypes of plants with various expression levels of ACHT2. Plants were grown for 4 wk. (B) Expression levels of ACHT2. (Left) The results of Western blotting with anti-ACHT2 antibody are shown. Values (%) indicate the loaded amounts of leaf extract proteins. Arrows indicate the proteins of interest. CBB-stained Rubisco large subunit (RbcL) is shown as a loading control. (Right) To compare the ACHT content more accurately, the data obtained from diluted samples (see SI Appendix, Fig. S7) were used for band intensity measurements. ACHT2 content for each mutant line relative to that of the Col-0 line was calculated and is shown as the mean ± SD (n = 3). Different letters indicate significant differences among plant lines (P < 0.05; one-way ANOVA and Tukey HSD). (C) Physiological parameters. Each value is presented as the mean ± SD (n = 3). Different letters indicate significant differences among plant lines (P < 0.05; one-way ANOVA and Tukey HSD).

