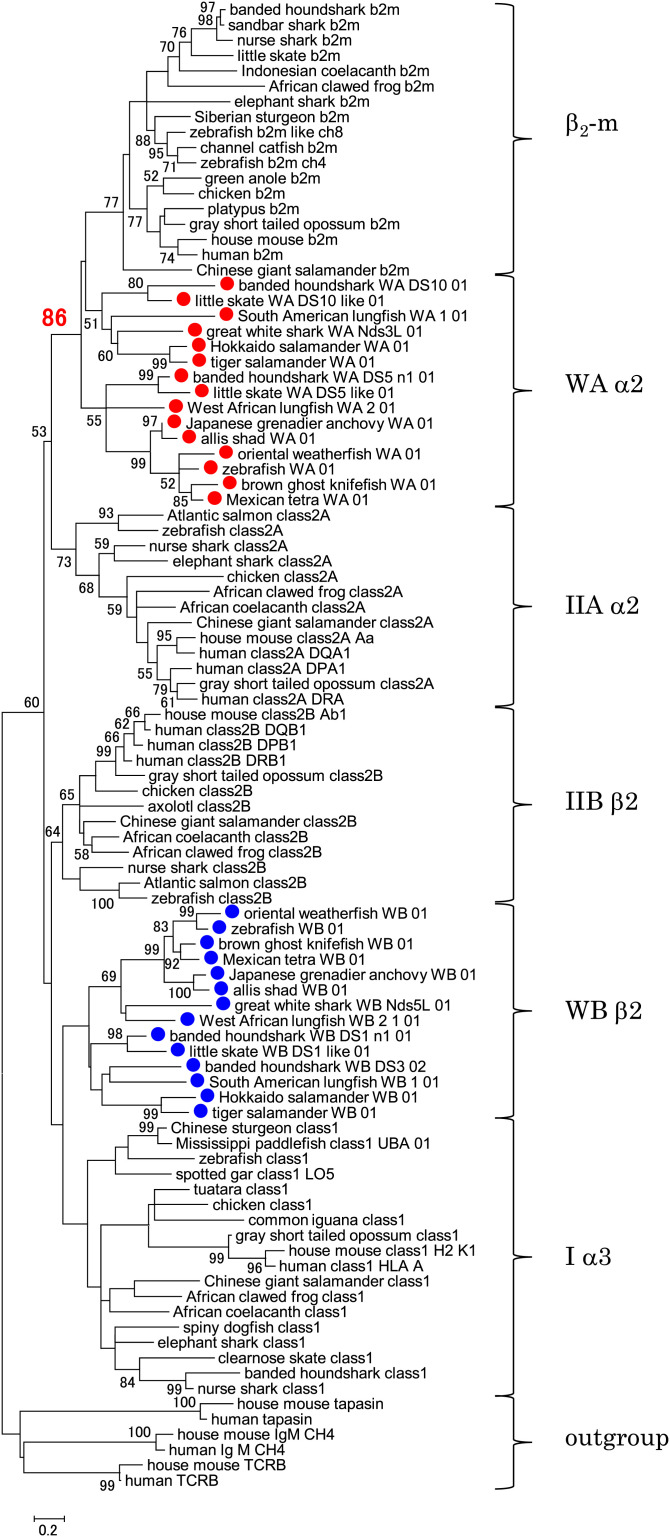
Fig. 7.
Close relationship between W-category α2 domain and β2-m of the MHC class I molecules. The phylogenetic tree was constructed with the amino acid sequences of the membrane-proximal, Ig-like, C1-set domains of selected MHC molecules using the maximum-likelihood method. The percentage of trees (bootstrap value, 50 or greater) in which respective sequences clustered together is shown next to the nodes. The bootstrap value at the WAα2/β2-m node is shown in red. The alignment used for this analysis is shown in Dataset S2. Red dots mark WAα2 sequences, and blue dots mark WBβ2 sequences. For outgroup sequences, C1-set domains of Ig M, TCRB (T cell receptor β chain), and tapasin were used. Similar phylogenetic tree analyses, including those with the DNA sequences, those using the neighbor-joining method for estimating phylogenetic trees, and those with more sequences, are shown in SI Appendix, Figs. S16–S18.

