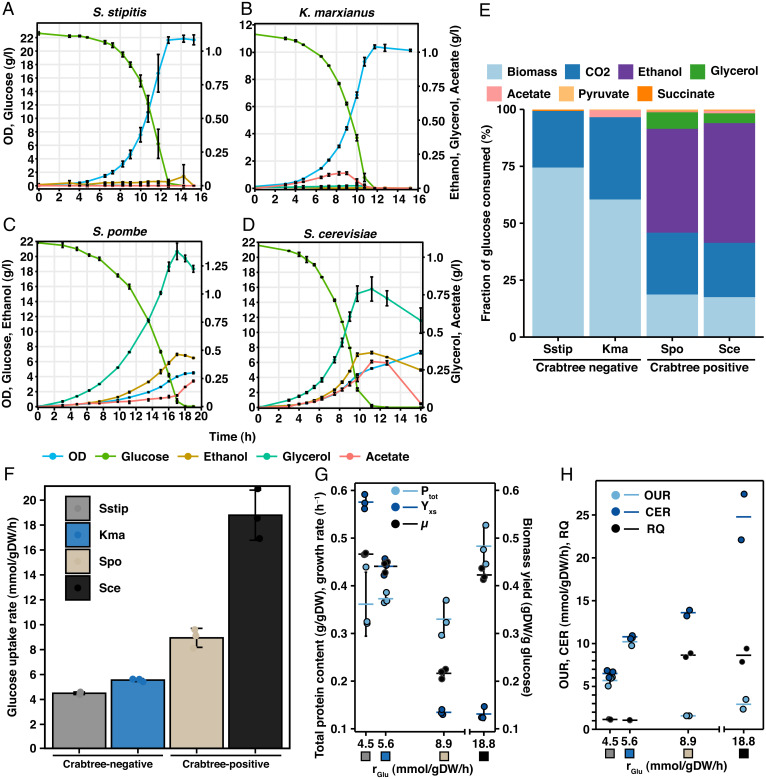
Fig. 1.
Characterization of physiological differences between Crabtree-positive and -negative yeast. (A–D) Cell density (optical density at 600 nm [OD600]) and extracellular concentrations of glucose, ethanol, glycerol, and acetate during the course of the batch cultivation. Mean values ± SD of biological triplicates are shown. See SI Appendix, Fig. S2 A–D for additional metabolites. (E) The fractional consumption of glucose, C-mmol/C-mol glucose, normalized against the total carbon recovery. Mean values of biological triplicates are shown. The carbon recovery was between 91 and 100% for all four yeasts. (F) GUR. Mean values ± SD of biological triplicates are shown. (G) Protein content (Ptot), biomass yield (Ysx), and growth rate (µ) plotted against GUR. Mean values ± SD and individual values of biological triplicates are shown. Colored boxed represent the organism, as indicated in panel F. (H) OUR, CER, and RQ plotted against GUR. Mean values ± SD and individual values of biological triplicates are shown for S. stipitis and mean values, and individual values for biological duplicates are shown for S. pombe, S. cerevisiae, and K. marxianus. Colored boxes represent the organism, as indicated in panel F. Spo, S. pombe; Sce, S. cerevisiae; Kma, K. marxianus; Sstip, S. stipitis.

