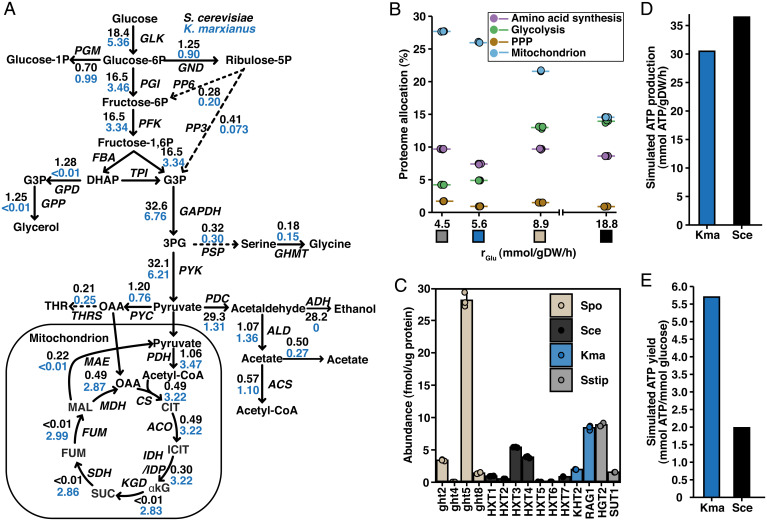
Fig. 2.
Adaptations in metabolism and proteome allocation reflect the trade-off between glucose utilization and ATP yield. (A) Flux distribution of central carbon metabolism as predicted by FBA using condition-specific enzyme-constrained models, constrained with experimentally measured exchange fluxes and protein levels. (B) Summed proteome allocation to selected processes plotted against GUR. Protein members of each process were defined by GO annotation. Individual values and mean values of biological triplicates are shown. Colored boxes represent the organism, as specified in Fig. 1F. See SI Appendix, Fig. S3 for absolute abundances of the pathways. (C) Protein abundance of glucose transporters measured in this study. Mean values ± SD of biological triplicates are shown. (D) ATP production rate calculated based on FBA simulation results. (E) ATP yield calculated from FBA simulation results. Spo, S. pombe; Sce, S. cerevisiae; Kma, K. marxianus; Sstip, S. stipitis.

