Fig. 3.
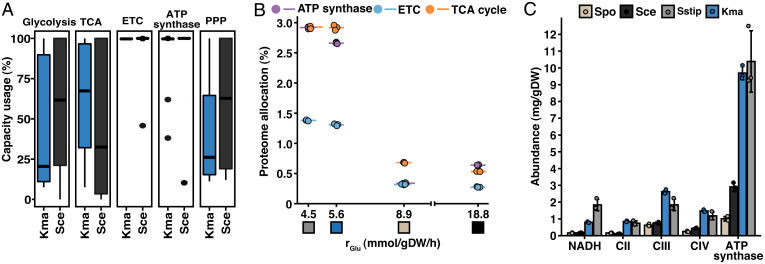
Limitations in the ETC and ATP synthase are characteristic for the Crabtree effect. (A) Capacity usage, calculated as the model-predicted enzyme levels divided by the experimentally measured enzyme levels, of the main pathways of central carbon metabolism (CCM). (B) Summed proteome allocation to processes of CCM plotted against GUR. Protein members of each process were defined by GO annotation. Mean values of biological triplicates are shown. Colored boxes represent the organism, as specified in panel C. See SI Appendix, Fig. S7A for absolute abundances of the processes. (C) Absolute protein abundances of the components constituting the ETC and ATP synthase. Mean values ± SD of biological triplicates are shown. See SI Appendix, Fig. S7B for proteome allocation of the components. PPP, pentose phosphate pathway; Spo, S. pombe; Sce, S. cerevisiae; Kma, K. marxianus; Sstip, S. stipitis.

