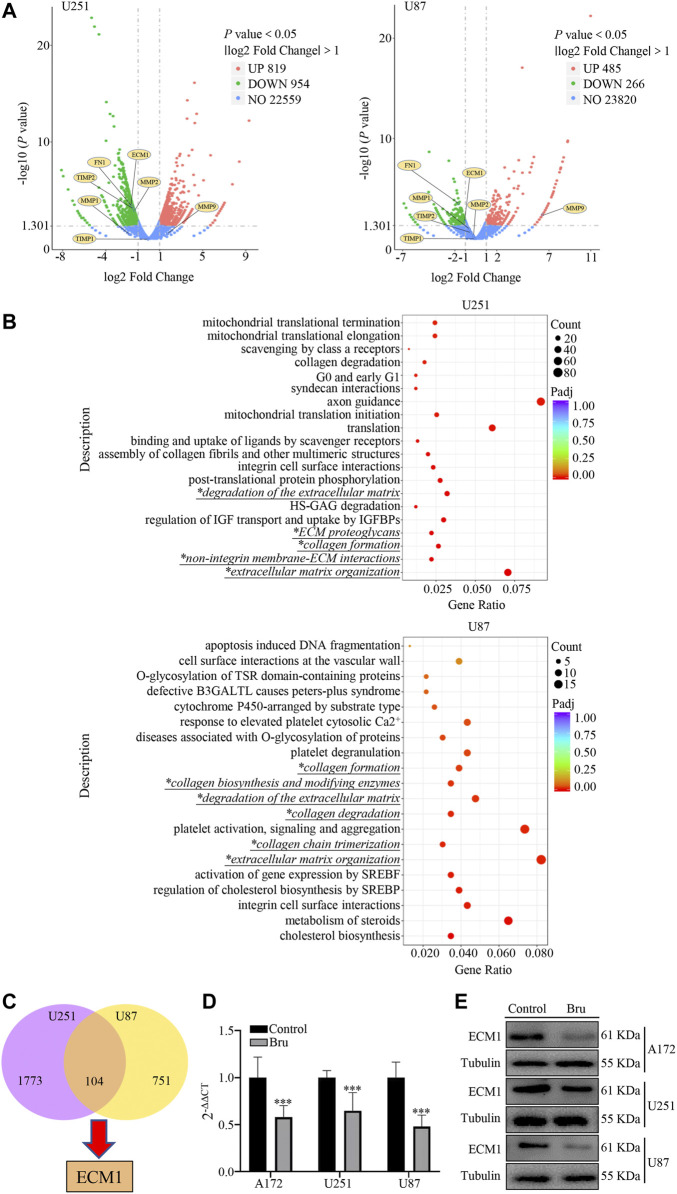
FIGURE 3.
The expression of ECM1 was involved in Bru-treated GBM cells. (A) The volcano plots of RNAs in U251 and U87 cells. The Log2 absciss presented the differences existing in Control and Bru-treated group. The vertical axis showed the p value, which represented the significance of the difference. The expression of ECM1 and other related genes were shown as volcano plots to indicate the location of these genes. (B) Reactome enrichment analysis of the gene expression profiles in U251 and U87 cells. 20 pathways were shown to be significantly regulated in Control and Bru-treated group. Italic Script with * represented collagen and extracellular matrix related pathways. (C) Venn diagram analysis of the gene expression profiles in U251 and U87 cells. There were 104 genes co-expressed in these two GBM cell lines. (D, E) The cells were treated with Bru for 48 h and then subjected to qRT-PCR analysis and western blot assay to verify the expression of ECM1. *p < 0.05, **p < 0.01, ***p < 0.001 vs., Control group.

