FIGURE 6.
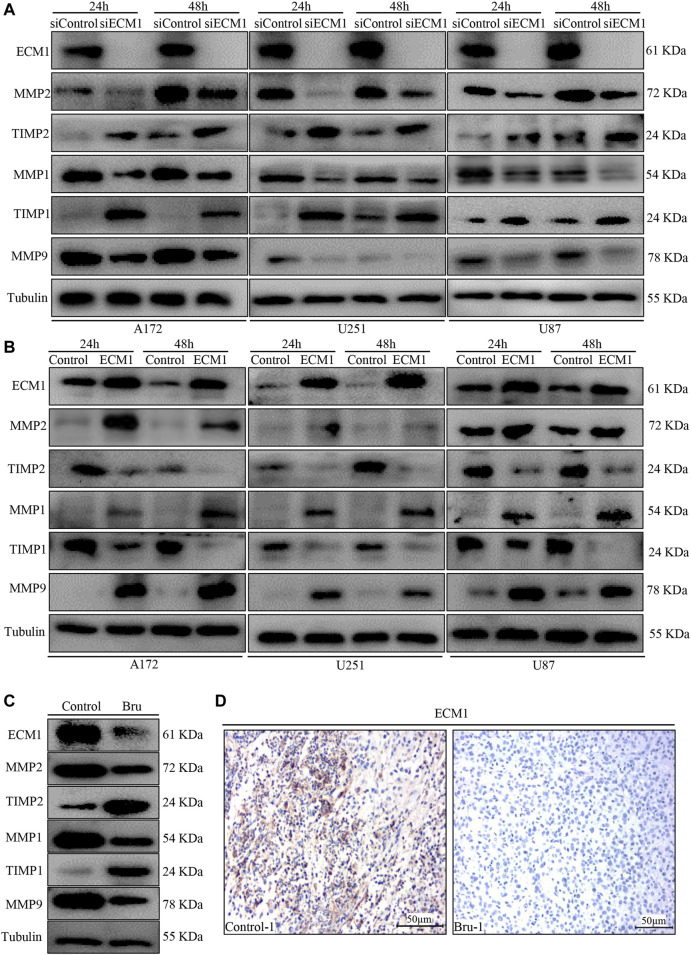
The effect of ECM1 on invasion-related biomarkers. (A) Cells were transfected with siControl or siECM1 for 24–48 h and subjected to immunoblot analysis for measuring the expression of indicated proteins. (B) Cells were infected with pLV-vector (Control) or pLV-ECM1 (ECM1) for 24–48 h and then subjected to immunoblot analysis for measuring the expression of indicated proteins. (C) Immunoblot analyses showing ECM1, MMP2, TIMP2, MMP1, TIMP1 and MMP9 expression levels in xenograft tumors. The blots shown here were representatives of the average of five subcutaneously transplanted tumors in nude mice. (D) Representative images of IHC staining showed that Bru decreased the levels of ECM1 in subcutaneously transplanted xenograft tumors ().

