Fig. 4.
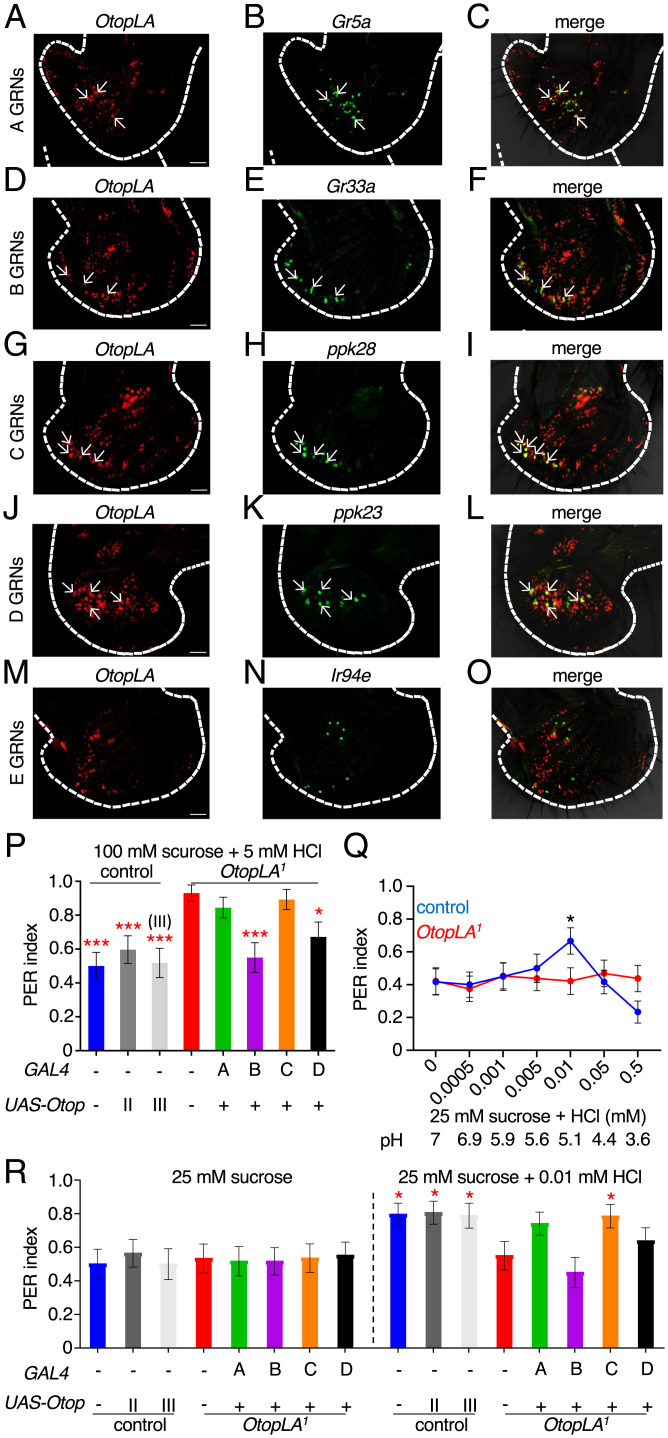
OtopLA functions in multiple GRNs for detection of acids. (A–O) Images of in situ hybridizations of OtopLA and the indicated reporters in labella from w1118 flies. In each row, the Left panel indicates the distribution of OtopLA transcripts (red). The Middle panel shows the markers for A–E GRNs (green). The Right panel shows the merge of the OtopLA RNAs and marker RNAs. (P) PER assays to investigate the effects of cell-specific rescue of OtopLA function to acid taste in OtopLA1 flies. The assays were performed using 100 mM sucrose plus 5 mM HCl. Genotypes tested: control (w1118), control with UAS-OtopLAp (chromosome II or III insertion), OtopLA1, and OtopLAp expressed in an OtopLA1 background using the Gr5a-GAL4 (A neurons), Gr66a-GAL4 (B neurons), ppk28-GAL4 (C neurons), and the ppk23-GAL4 (D neurons). Control, n = 27. UAS-OtopLAp (chromosome II), n = 31. UAS-OtopLAp (chromosome III), n = 26. OtopLA1, n = 29. OtopLAp rescued in: A neurons, n = 29. B neurons, n = 30. C neurons, n = 28. D neurons, n = 29. (Q) PER assays using 25 mM sucrose and the indicated concentrations of HCl. The pH values of the solutions are indicated. Control (w1118), n = 30. OtopLA1, n = 33. (R) PER assays to investigate the effects of cell-specific rescue of OtopLA function in restoring attraction to 0.01 mM HCl. Genotypes tested: (w1118), control with UAS-OtopLAp (chromosome II or III insertion), OtopLA1, and OtopLAp expressed in OtopLA1 background using Gr5a-GAL4 (A neurons), Gr66a-GAL4 (B neurons), ppk28-GAL4 (C neurons), and ppk23-GAL4 (D neurons). PER indices were obtained by testing either with 25 mM sucrose alone or 25 mM sucrose mixed with 0.01 mM HCl. Asterisks indicate statistically significant differences from OtopLA1 flies tested with 25 mM sucrose laced with 0.01 mM HCl. Control, n = 27. UAS-OtopLAp (chromosome II), n = 31. UAS-OtopLAp (chromosome III), n = 26. OtopLA1, n = 29. OtopLAp rescued in: A neurons, n = 29. B neurons, n = 30. C neurons, n = 28. D neurons, n = 29 (Scale bars, 10 μm). Mann–Whitney U tests. Error bars, SEMs. *P < 0.05, **P < 0.01, and ***P < 0.001.

