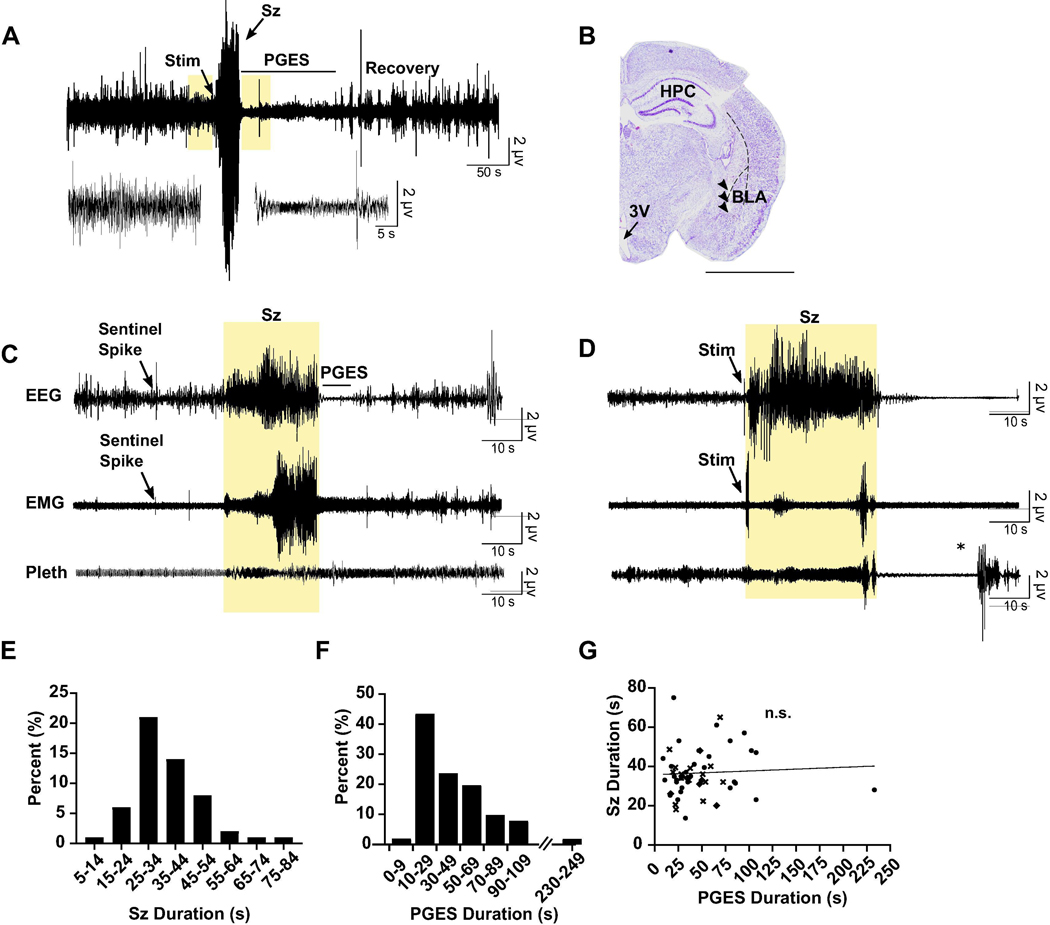
Figure 1.
PGES was consistently observed following seizures in amygdala kindled mice. (A) Top: 500 s raw EEG trace depicting seizure stimulation (Stim), seizure (Sz), PGES (duration indicated by horizontal line), and gradual EEG recovery in a C57BL/6J mouse. Scale bars: horizontal, 50 s; vertical, 2 μV. Bottom traces correspond to boxes on top trace and demonstrate EEG at baseline and during PGES. Scale bars: horizontal, 5 s; vertical 2 μV. (B) Nissl stained coronal hemi-section demonstrating electrode tract (arrowheads) in the basolateral amygdala. HPC, hippocampus; 3V, third ventricle; BLA, basolateral amygdala. Scale bar: 3 mm. (C) 150 s raw EEG (top), EMG (middle), and plethysmography (Pleth; bottom) traces depicting a spontaneous seizure (highlighted) emerging from non-rapid eye movement (NREM) in a kindled mouse. PGES duration is indicated by horizontal line. Scale bars: horizontal, 10 s; vertical 2 μV. (D) 150 s raw EEG (top), EMG (middle), and plethysmography (bottom) traces depicting a seizure stimulation and seizure (highlighted) that led to death in a kindled mouse. Scale bars: horizontal, 10 s; vertical 2 μV. *, Artifact from opening chamber. (E,F) Average seizure durations (E) and PGES durations (F) in the amygdala kindled mice. (G) Linear regression analysis of seizure duration in amygdala kindled mice versus PGES duration. Symbols represent different groups of animals.

