Figure 5.

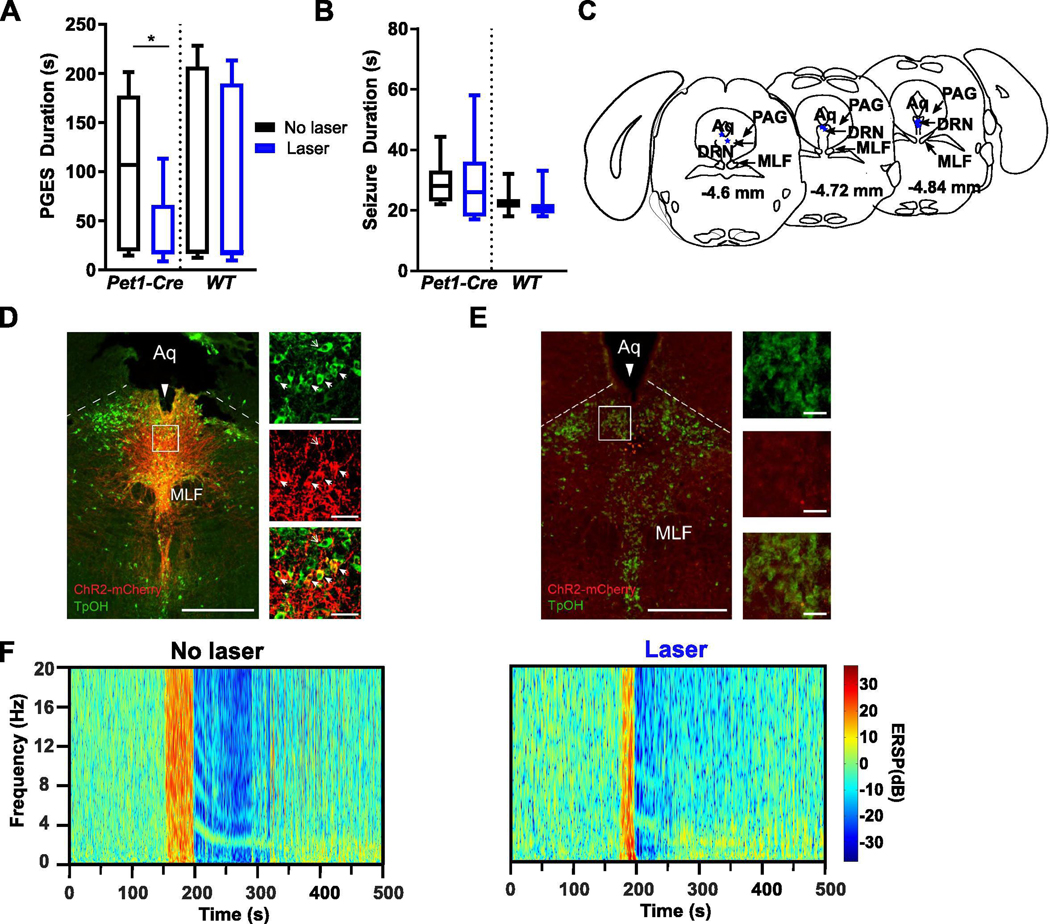
Optogenetic stimulation of the dorsal raphe nucleus (DRN) reduced PGES following seizures in amygdala kindled mice. (A, B) Duration of PGES (A) and seizures (B) following laser stimulation (blue; 473 nm; 4 Hz, 10 mW, 2% duty; 10 s on / 10 s off) or no stimulation (black) in DRN neurons prior to seizure induction during wake in Pet1-Cre (n = 7) and WT (n = 8) mice injected with AAV-ChR2 into the DRN. *, p < 0.05. (C) Depiction of optic fiber positioning within the DRN in Pet1-Cre mice injected with AAV-ChR2. Aq, aqueduct; DRN, dorsal raphe nucleus; MLF, medial longitudinal fasciculus; PAG, periaqueductal gray. (D,E) Immunostained coronal section depicting optical fiber tracts (long solid arrow), ChR2 expression (red), serotonergic (5-HT) cell bodies (green/non-solid small arrow), and co-expression (yellow/solid small arrows) within the DRN of a Pet1-Cre (D) and WT (E) mouse that received an injection of AAV-ChR2 into DRN. Box indicates location of magnified cells on right (top, 5-HT cells; middle, ChR2; bottom, merge). Aq, aqueduct; MLF, medial longitudinal fasciculus; PAG, periaqueductal gray. Scale bar: 500 μm, 50 μm. (F) Representative spectral plots of PGES duration following either no laser (left) or laser stimulation (right) of DRN 5-HT neurons prior to seizure induction in a Pet1-Cre mouse injected with AAV-ChR2.
