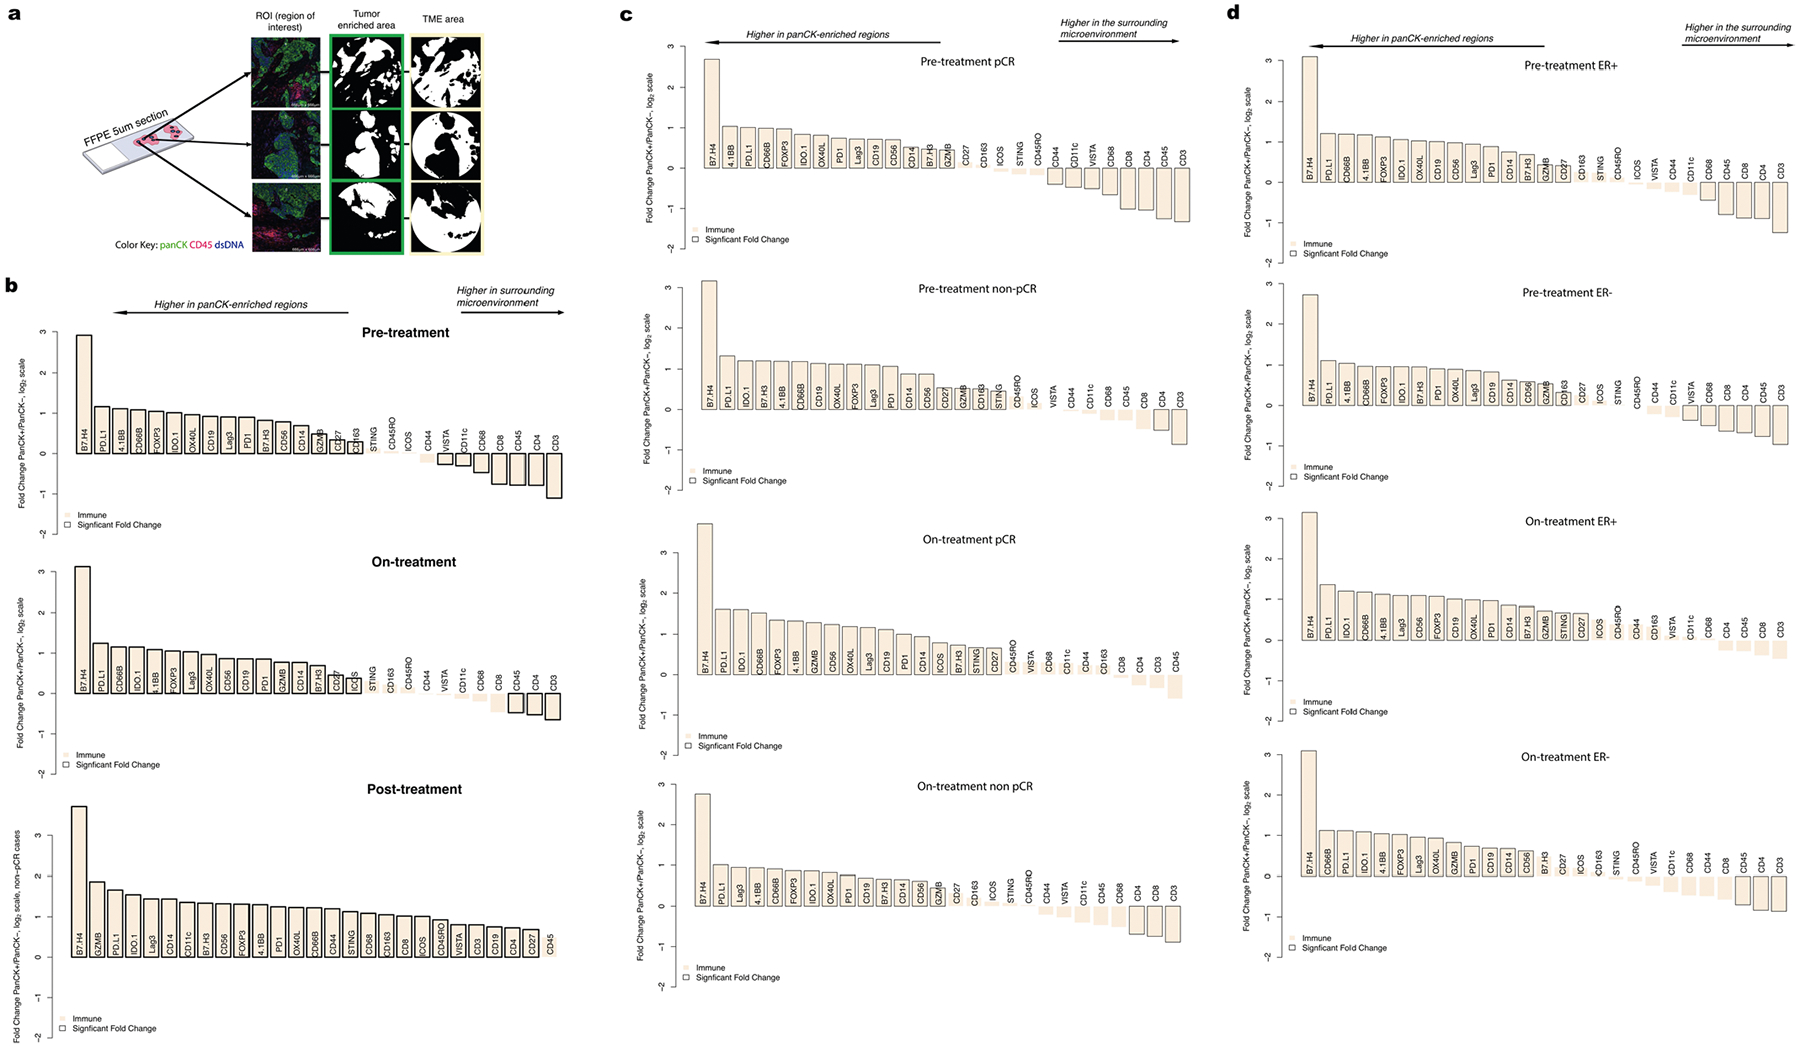
Extended Data Fig. 7 |. Comparison of immune markers in panCK-enriched and panCK-negative regions.

a. Digital Spatial Profiling (DSP) was performed on multiple regions of interest (ROIs) per tissue sample. Protein counts were measured within phenotypic regions corresponding to the PanCK-enriched (tumor-enriched) masks that include tumor cells and co-localized immune cells and separately for the inverted mask corresponding to panCK-negative (tumor microenvironment, TME) regions. b–d. Waterfall plots, generated using the DSP protein data, comparing immune marker expression between the panCK-enriched regions and the surrounding panCK-negative regions. Analyses based on the discovery cohort (n = 28 tumors). b. A comparison of all data pre-treatment on-treatment, and post-treatment. c. A comparison of pre-treatment and on-treatment timepoints, in pCR (n = 14) and non-pCR cases (n = 14). Pre-treatment, the correlation between immune marker fold-change values in the pCR and non-pCR cases was 0.98 indicating similar immune distribution across the panCK-enriched regions and surrounding microenvironment regardless of pCR outcome and this correlation remained high on-treatment (0.95). d. A comparison of pre-treatment and on-treatment timepoints, in ER-positive cases (n = 14), and ER-negative cases (n = 14).
