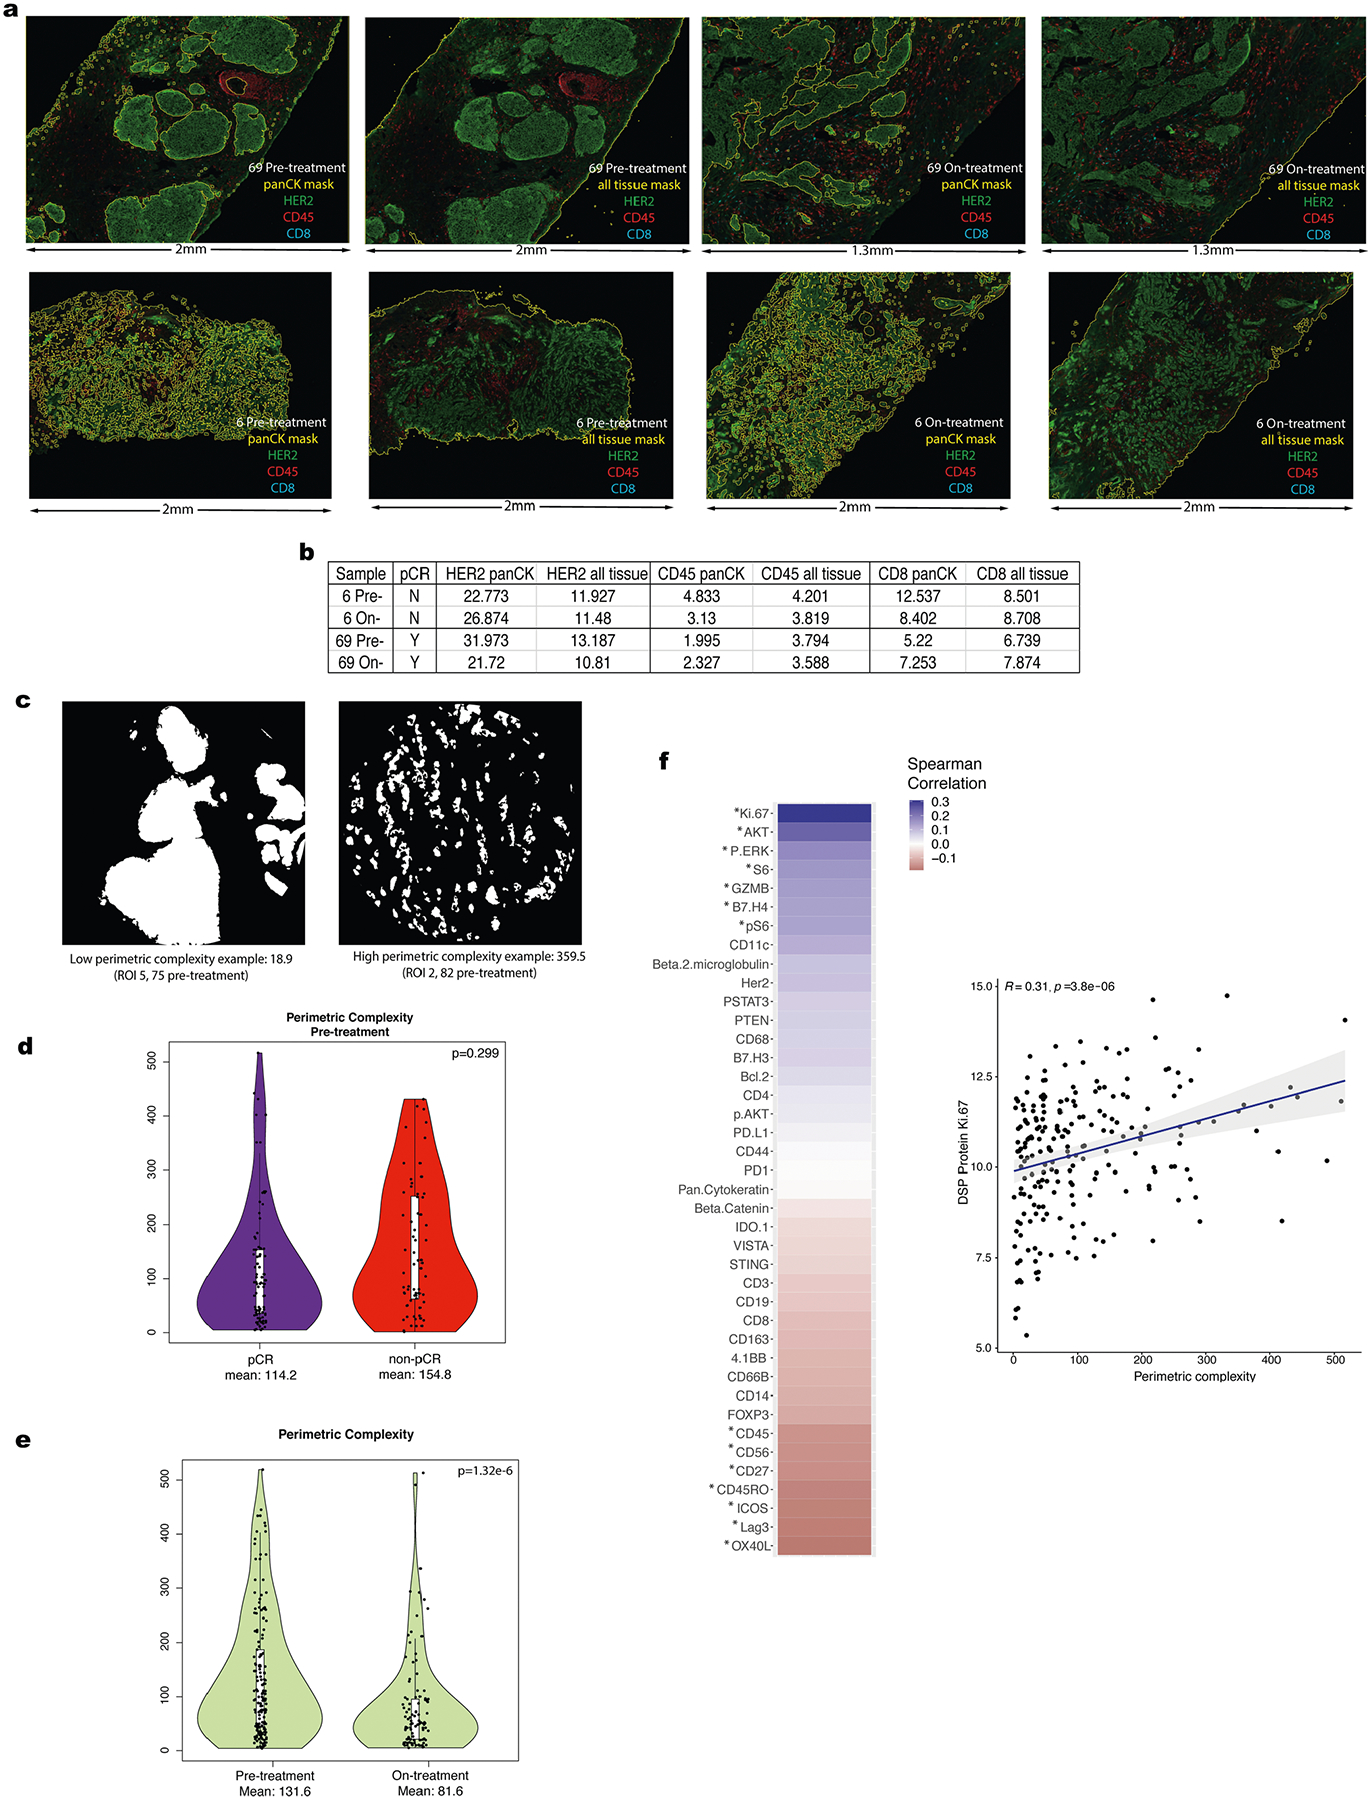
Extended Data Fig. 8 |. Multiplex immunohistochemistry and perimetric complexity.

a. Multiplex immunohistochemistry (mIHC) images showing the distribution of HER2, CD45, and CD8 signal in representative tissue stamps pre-treatment and on-treatment. The panCK mIHC channel (not shown) was used to generate the panCK mask and the tissue mask (outlined in yellow). Due to the limiting nature of the biopsy specimens which derive from independent donors, we did not perform technical replicates of the mIHC pilot experiments. b. IHC marker expression levels for HER2, CD45, and CD8 were quantified for the whole tissue section (across all digitized sub-images) and within the panCK-enriched tumor regions (across all digitized sub-images). c. Illustration of panCK-enriched binary masks and perimetric complexity-based quantification of the tumor-microenvironment border. d. Comparison of perimetric complexity values pre-treatment between pCR cases and non-pCR cases. The p-value was derived using a linear mixed-effect model (two-sided test) over the multi-region data with blocking by patient (n = 28 patients). Adjustments were not made for multiple comparisons. For each violin plot, the white box represents the interquartile range and the black lines extending from the white box represent 1.5X the interquartile range. e. Comparison of pre-treatment versus on-treatment perimetric complexity values. PanCK-enriched ROIs were used to quantify perimetric complexity. P-values computed with a linear model, blocked by patient (n = 28 patients). Adjustments were not made for multiple comparisons. For each violin plot, the white box represents the interquartile range and the black lines extending from the white box represent 1.5X the interquartile range. f. Spearman correlation between the DSP protein expression values and perimetric complexity per region of interest (ROI) in the pre-treatment and on-treatment tissue specimens from the discovery cohort. Significantly correlated probes: p-value < .05 are denoted by an asterisk. P value is assessed via a one-sided t-test (correlation coefficient not equal to 0). Correlation plot for Ki-67, the marker with the highest correlation with perimetric complexity, where each dot represents an individual ROI. The grey shading indicates the 95% confidence interval of the correlation coefficient. Analyses are based on the discovery cohort (n = 28 patients).
