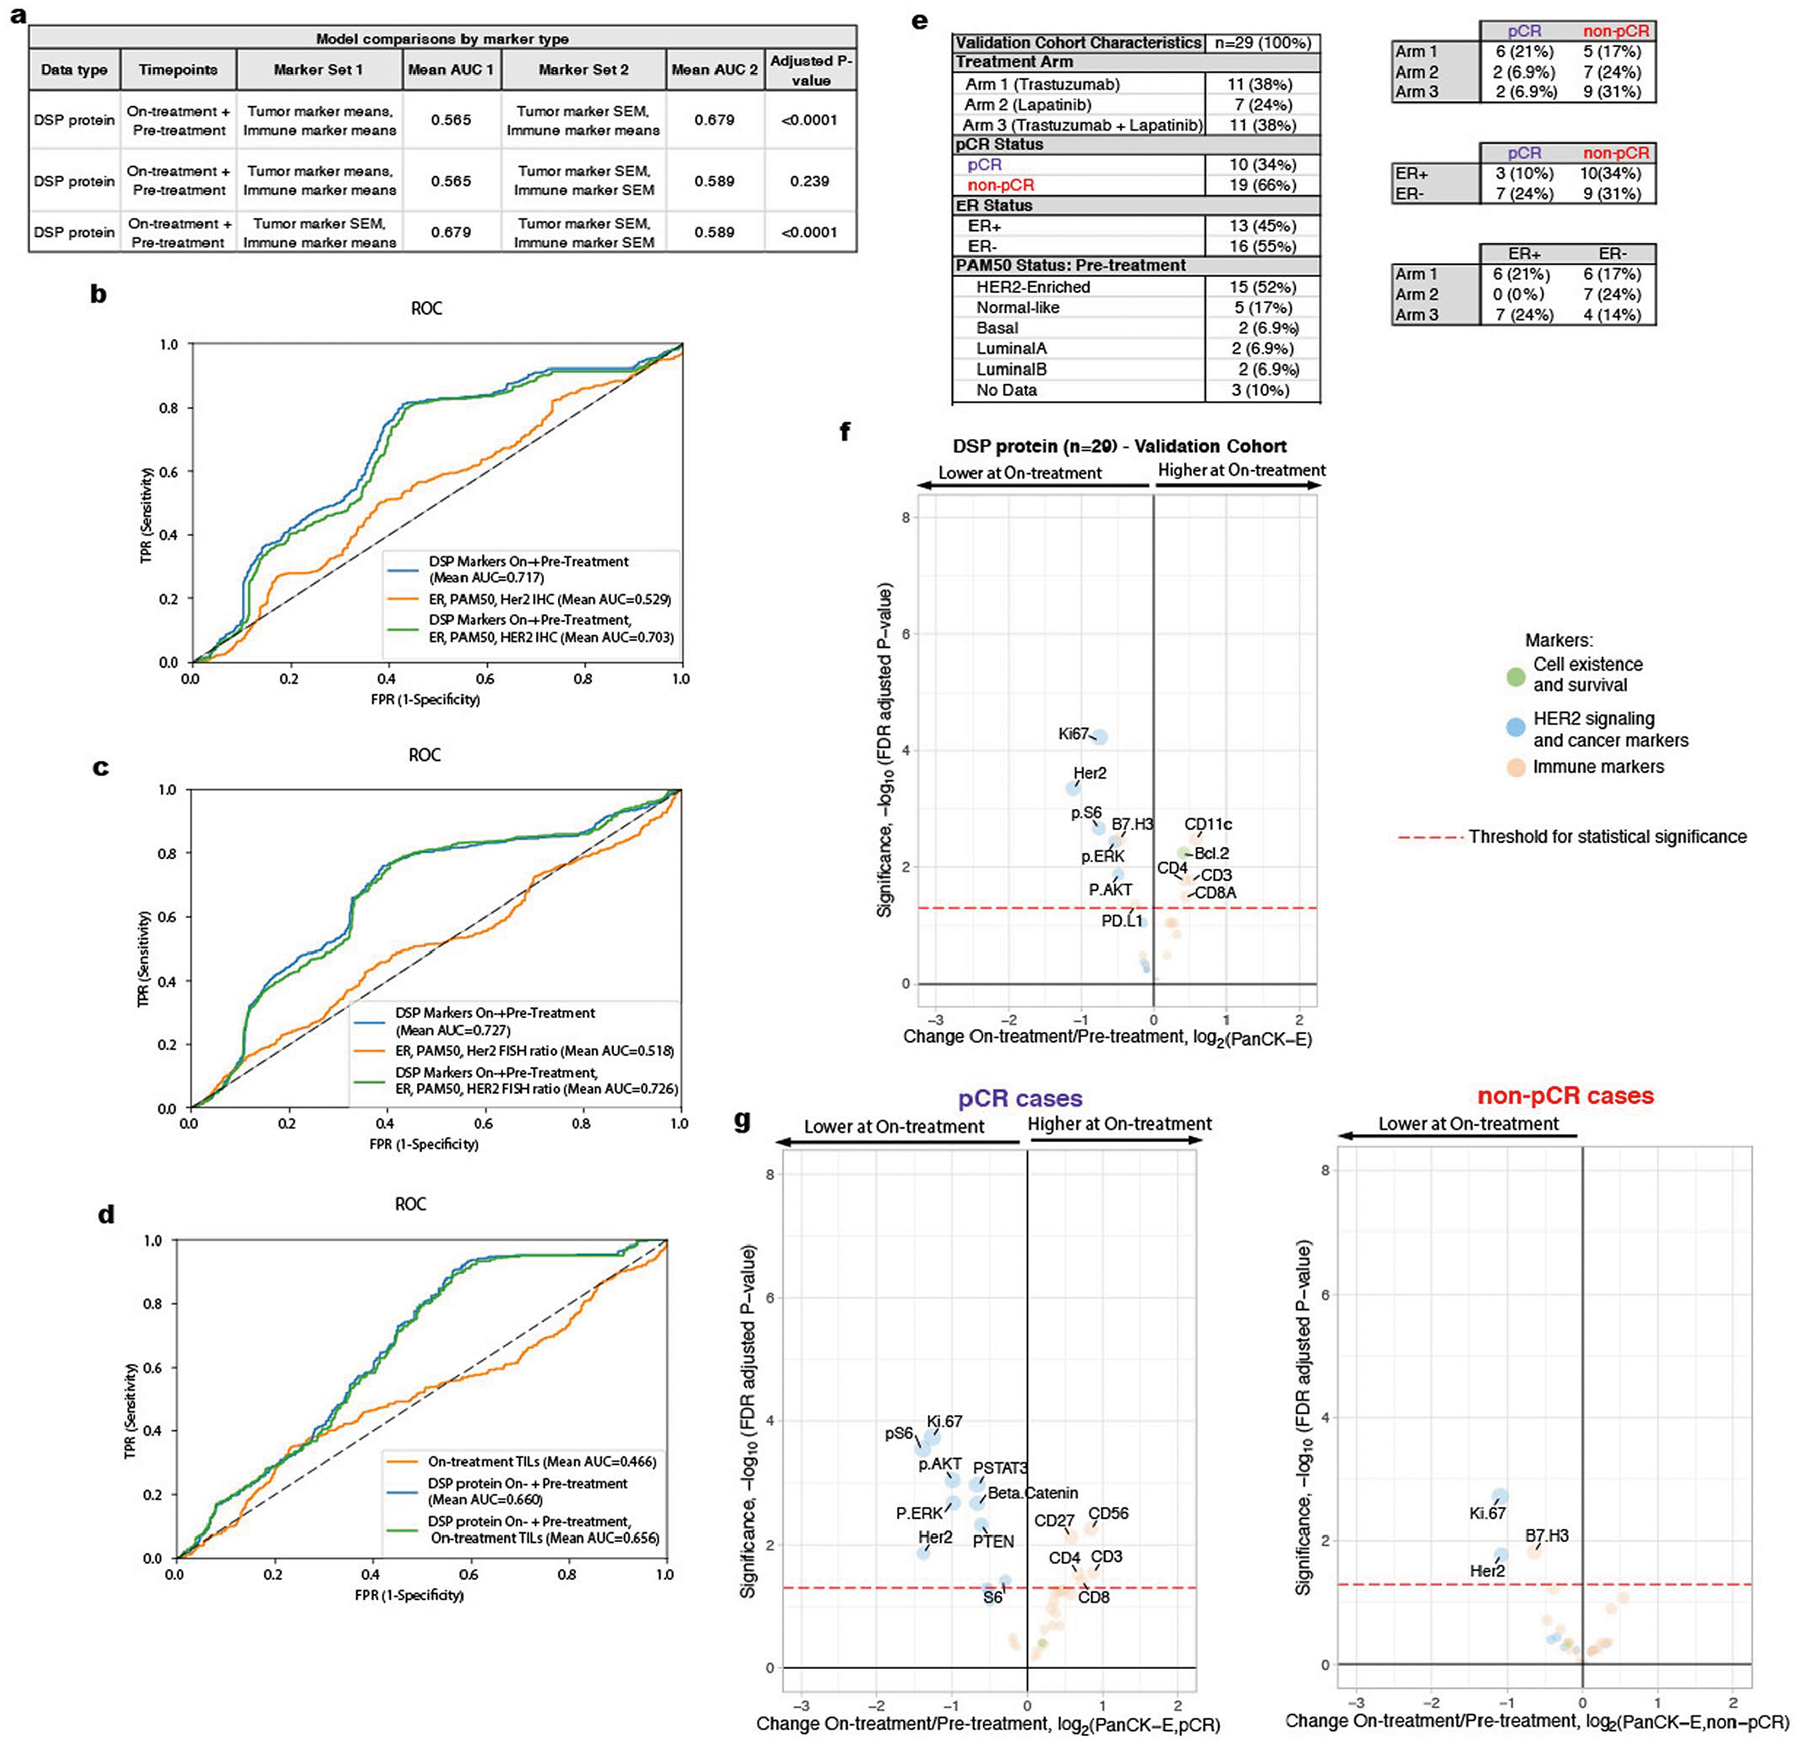
Extended Data Fig. 9 |. Comparison of alternative models including non-DSP measures and model validation cohort.

a. AUROC (Area Under the Receiver Operating Characteristics) performance (using nested cross-validation with Holm-Bonferroni correction for multiple hypotheses) comparing DSP protein on- plus pre-treatment L2-regularized classifiers trained using marker means versus marker standard error of the mean (SEM) for tumor markers and immune markers (n = 23 patients with paired data across both timepoints). b–d. Receiver operating characteristic (ROC) curves and AUROC quantification for the On- plus Pre-treatment DSP protein L2-regularized classifier using all 40 markers compared to other models: (b) model trained using estrogen receptor (ER) status, PAM50 status, and HER2 IHC (3 + vs other) (n = 19 patient) and model incorporating these three measures as well as On- plus Pre-treatment DSP; (c) model trained using Er status, PAM50 status, and pre-treatment HER2 FISH ratio (n = 21 patients) and model incorporating these three measures as well as On- plus Pre-treatment DSP; (d) model trained using on-treatment stromal tumor infiltrating lymphocytes (TILs) (n = 16 patients) and model incorporating TILs as well as On- plus Pre-treatment DSP. Model comparisons were performed in the discovery cohort. e. Summary of the clinical characteristics for the TRIO-US B07 clinical trial Digital Spatial Profiling (DSP) validation cohort used for model testing. Treatment arm, pathologic complete response (pCR), ER status, and PAM50 status inferred based on pre-treatment bulk expression data are included. Two-way contingency tables compare the distribution of ER status, pCR status, and treatment arm. f. Volcano plot demonstrating treatment-associated changes based on comparison of pre-treatment versus on-treatment protein marker expression levels in pancytokeratin-enriched (PanCK-E) regions in the validation cohort (n = 29 patients). g. Volcano plots demonstrating treatment-associated changes in pCR versus non-pCR cases in the PanCK-E regions in the validation cohort (n = 29 patients). Significance, −log10(FDR adjusted p-value), is indicated along the y-axis. The p-value was derived using a linear mixed-effect model (two-sided test) over the multi-region data with blocking by patient.
