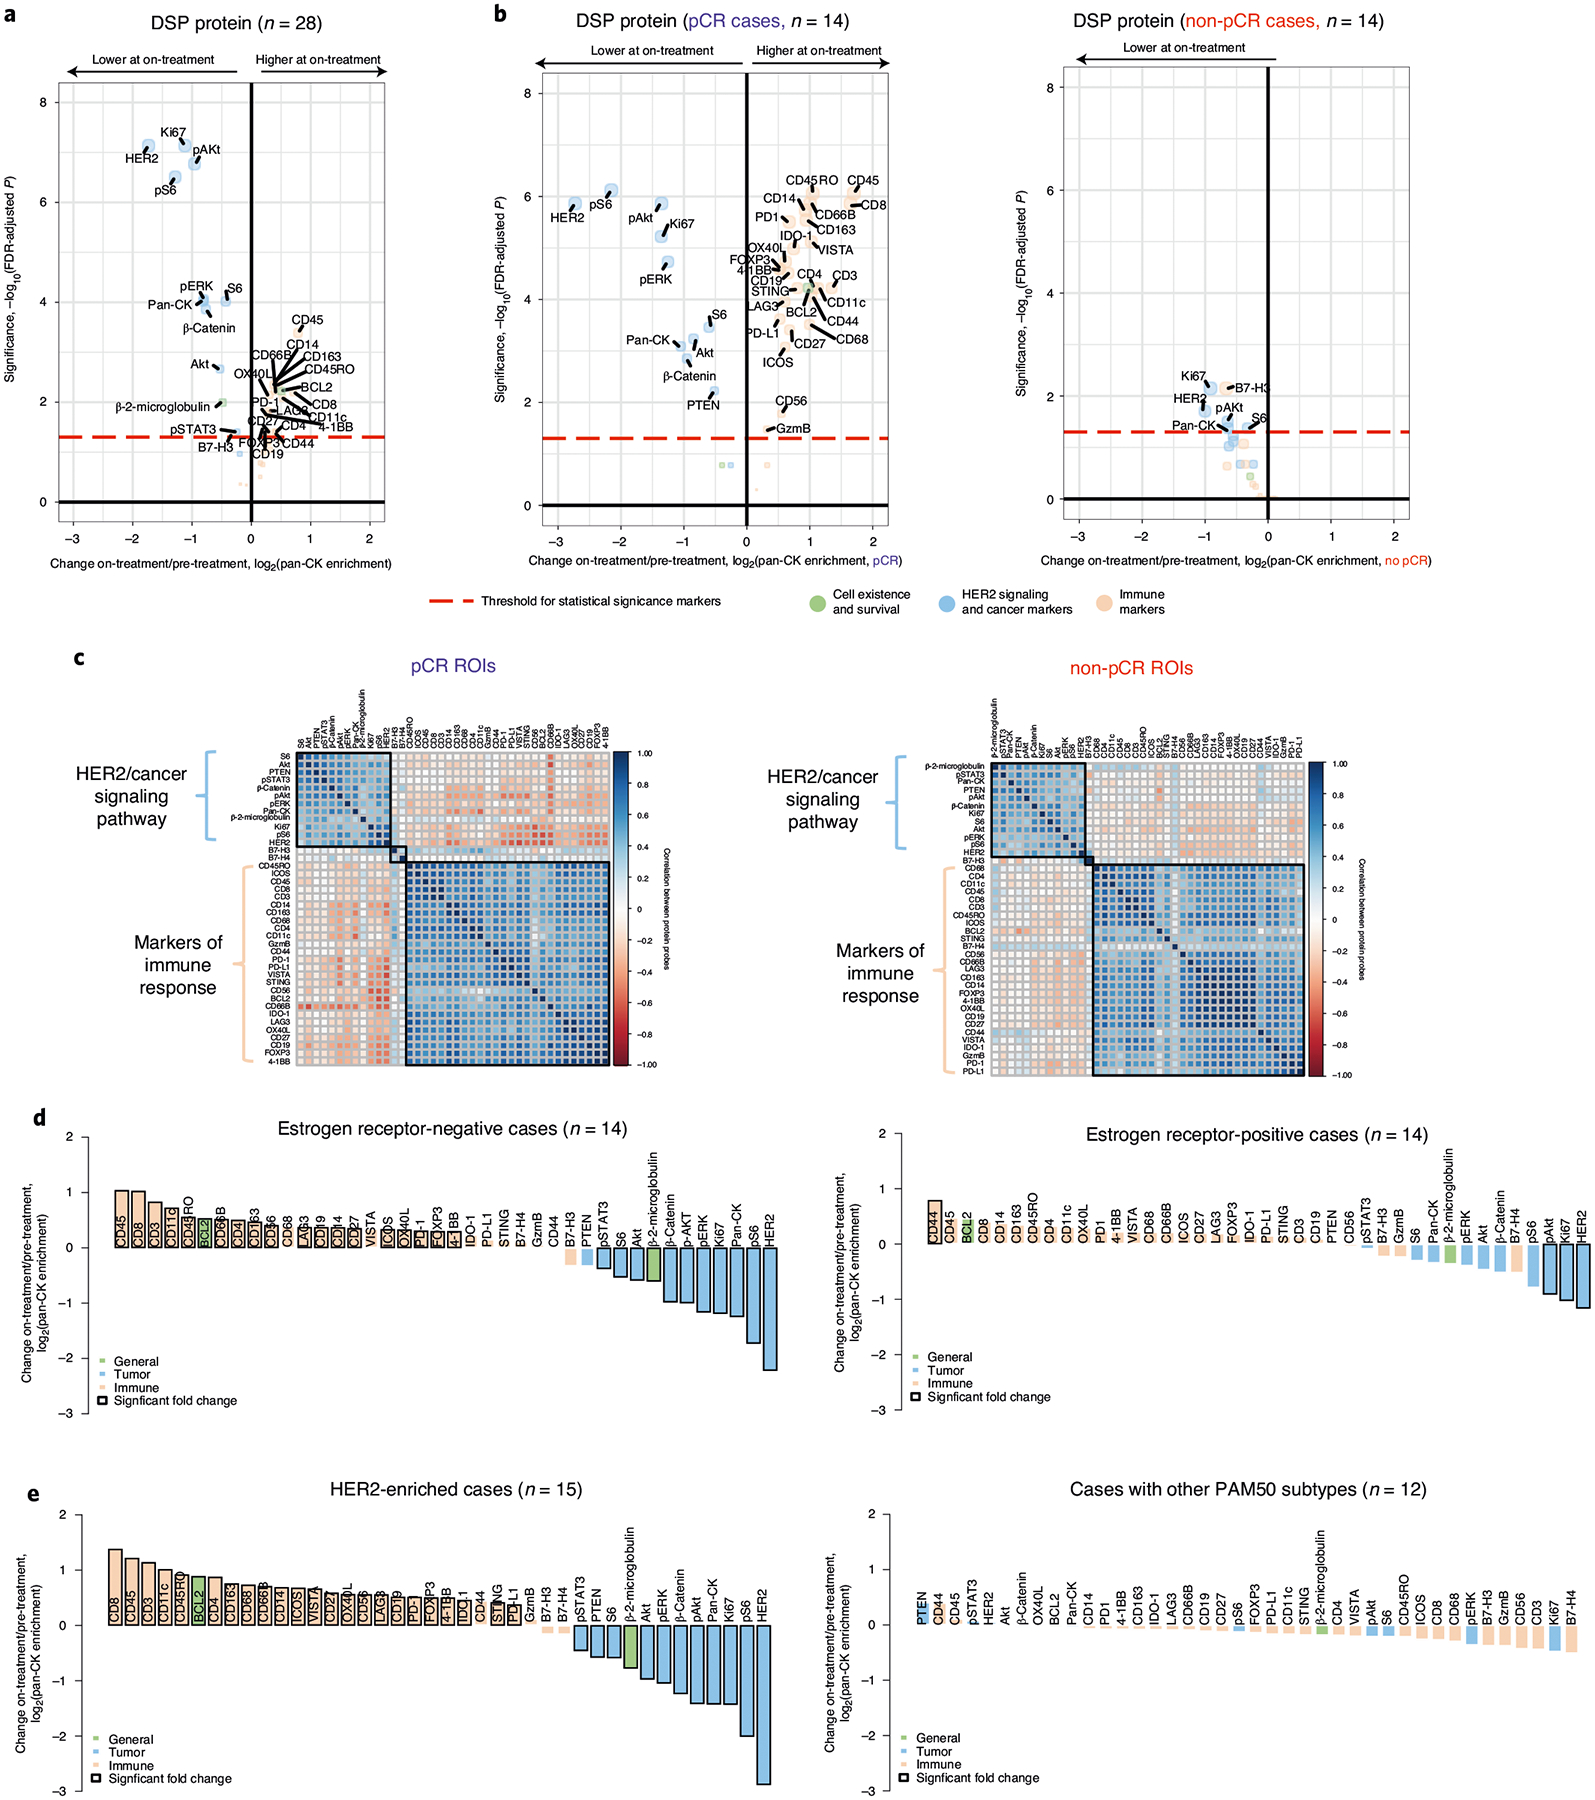
Fig. 2 |. Spatial proteomic analysis reveals changes in cancer signaling and immune infiltration after short-term HER2-targeted therapy.

a, Volcano plot demonstrating treatment-associated changes based on comparison of pre-treatment versus on-treatment protein marker expression levels in pan-CK-enriched regions. Significance, −log10(FDr-adjusted P), is indicated along the y axis. The P value is determined based on a linear mixed-effects model (two-sided test) with blocking by patient and is derived from the t-value (a measure of the size of the difference relative to the variation in the sample data). n indicates the number of biologically independent cases used in the analysis. b, Volcano plots demonstrating treatment-associated changes in pCR versus non-pCR cases. n indicates the number of biologically independent cases used in each analysis. c, Pairwise correlation of protein markers in pCR versus non-pCR cases. The black squares demarcate hierarchical clusters. d, Waterfall plots illustrating treatment-associated changes (pre-treatment to on-treatment) in estrogen receptor-positive and estrogen receptor-negative cases based on protein expression. e, Waterfall plots illustrating treatment-associated changes in DSP protein expression (pre-treatment to on-treatment) in HER2-enriched and non-HER2-enriched cases (n = 7 normal-like, n = 2 luminal B, n = 2 basal, n = 1 luminal A). Analyses were performed in the discovery cohort.
