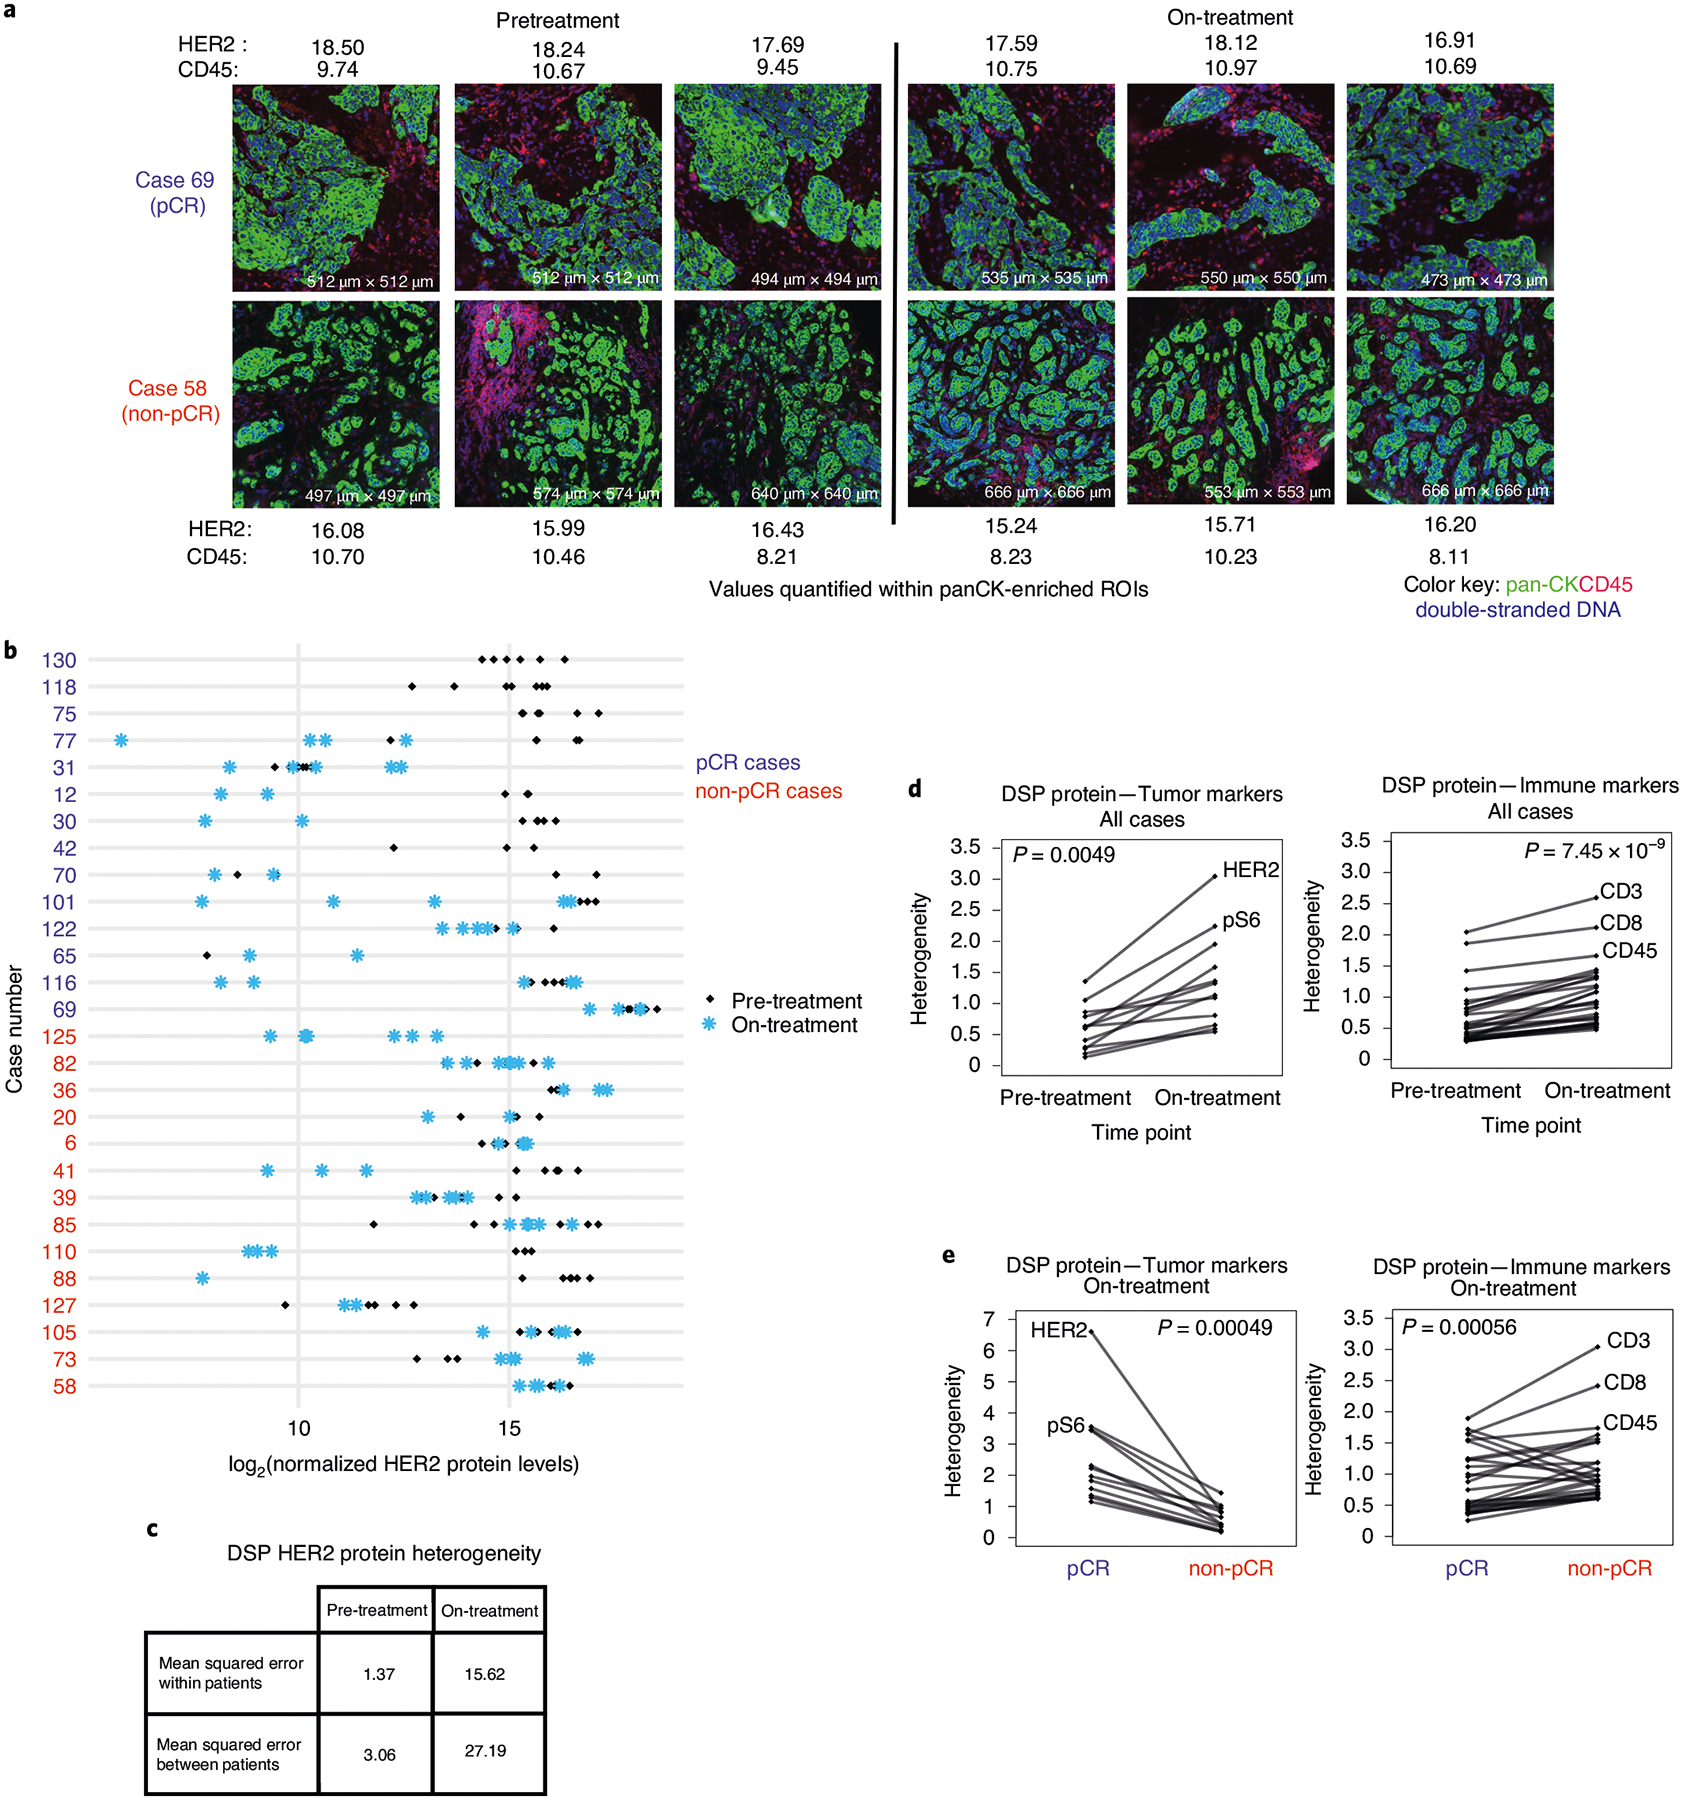
Fig. 3 |. Increased heterogeneity of tumor and immune markers during HER2-targeted therapy.

a, representative images of ROIs from two cases and quantification of HER2 and CD45 protein levels (log2-normalized) in pan-CK-enriched regions. b, Comparison of DSP HER2 protein levels pre-treatment and on-treatment for all regions profiled per case per time point (n = 28 patients). c, Comparison of the mean squared error in DSP HER2 protein expression pre-treatment versus on-treatment within and between patients. d, Pre-treatment versus on-treatment heterogeneity for each DSP tumor and immune marker. e, On-treatment heterogeneity in DSP protein markers for pCR and non-pCR cases. Heterogeneity was calculated as the mean squared error within patients based on ANOVA in c–e. P values are based on a two-sided paired Wilcoxon signed-rank test. Analyses are based on the discovery cohort (n = 28 patients).
