
Fig. 4 |. DSP of pan-CK-enriched paired pre- and on-treatment biopsies is associated with pathological complete response in the discovery cohort and outperforms established markers.
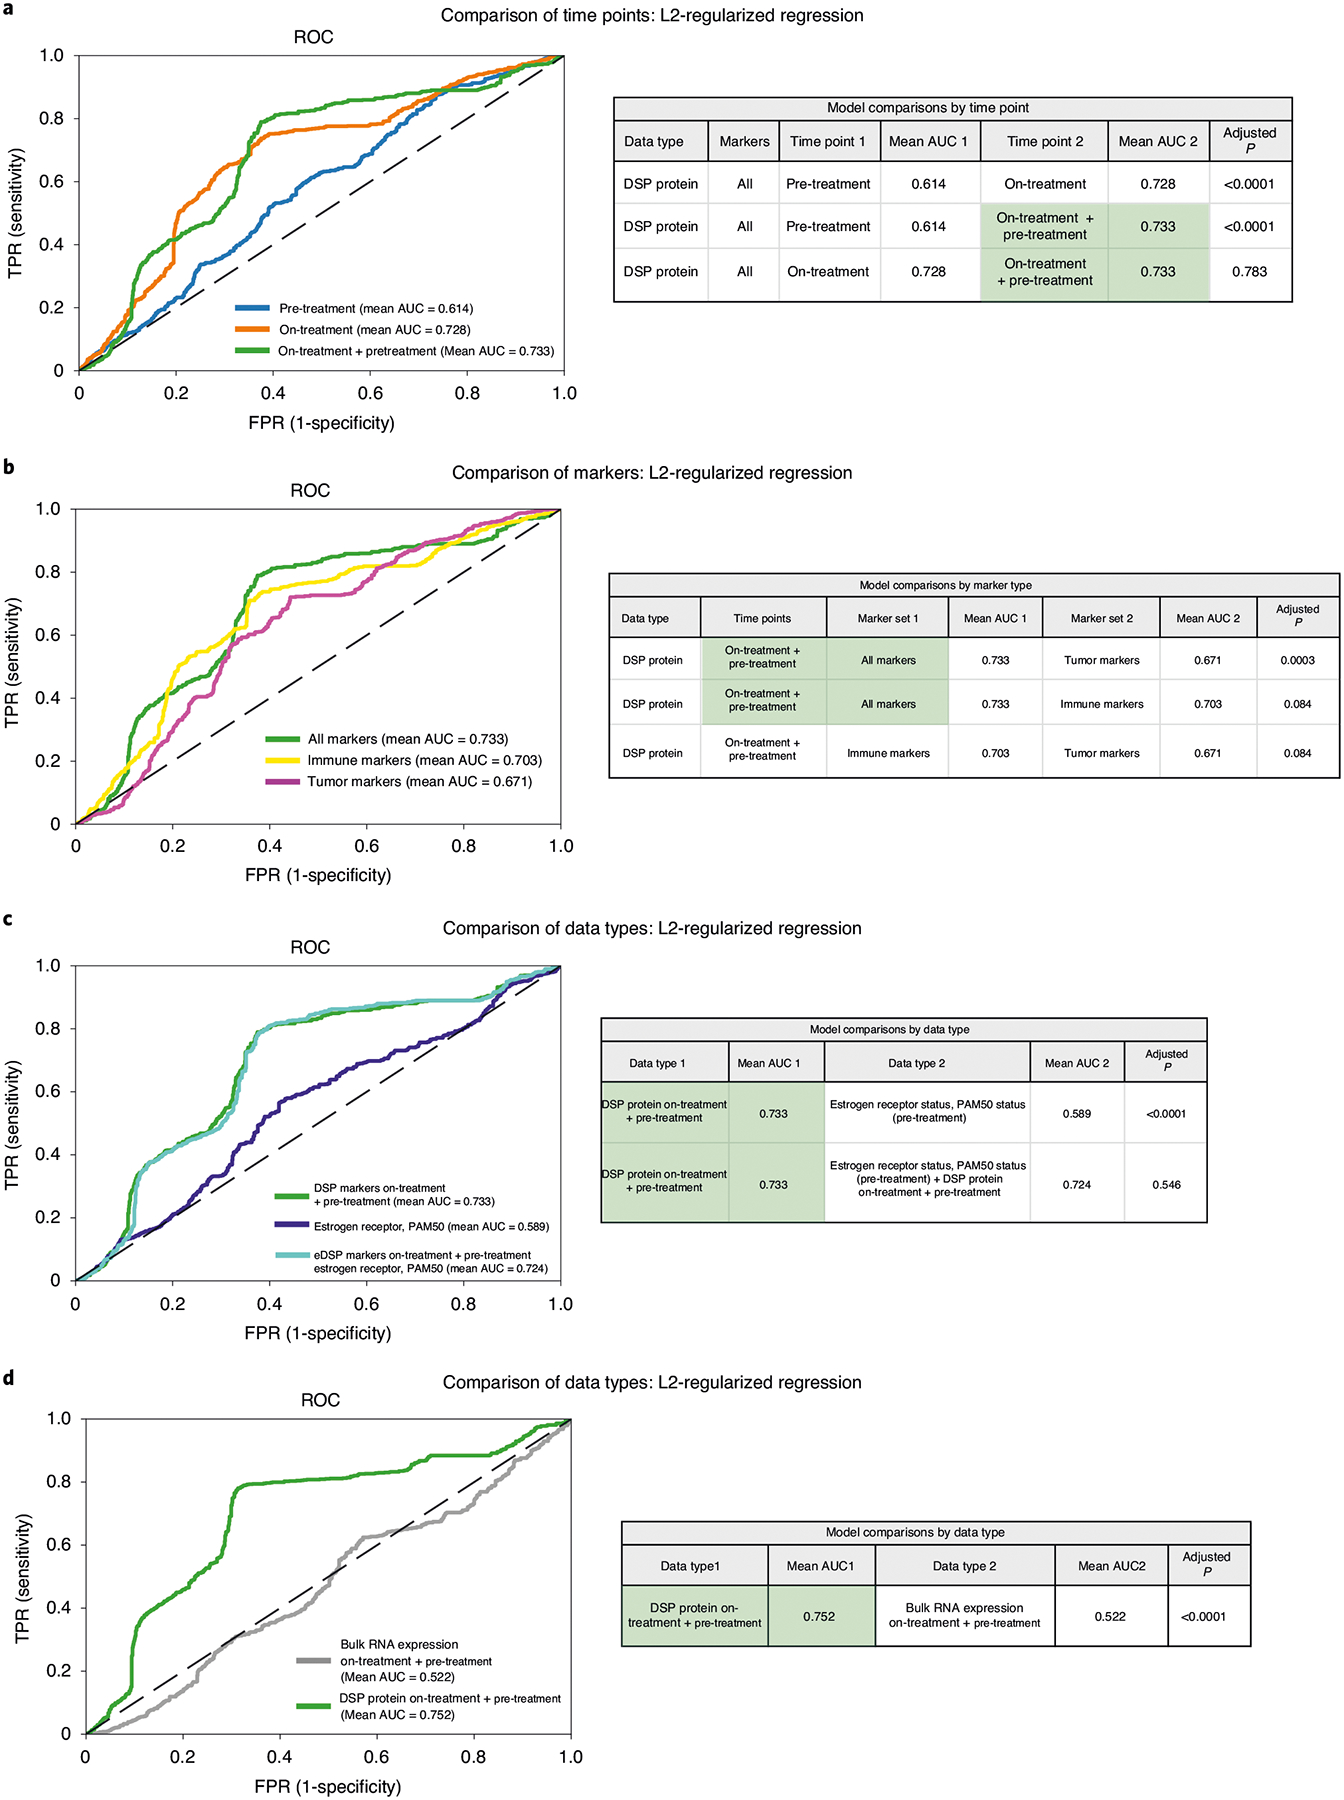
The AUROC performance of various models was compared using nested cross-validation (based on a two-sided t-test) with Holm–Bonferroni correction for multiple hypotheses in the discovery (training) cohort (n = 23 patients with paired data for both time points). a–c, ROC curves were generated using cases with DSP pan-CK-enriched data from both the pre-treatment and on-treatment time points (23 biologically independent cases were used in these analyses). a, ROC curves and statistical comparison of L2-regularized classifiers trained using DSP protein marker mean values (averaged across ROIs) pre-treatment, on-treatment and the combination of pre-treatment and on-treatment (‘on-treatment + pre-treatment’). AUC, area under the curve. b, ROC curves and statistical comparison of DSP protein on-treatment + pre-treatment L2-regularized classifiers trained using all marker, tumor marker and immune marker mean values. Cross-region mean marker values from both the pre-treatment and on-treatment time points were used in this analysis. c, ROC curves and statistical comparison of the on-treatment + pre-treatment DSP protein L2-regularized classifier to a model trained using estrogen receptor and PAM50 status. These two models were compared to a model that incorporates on-treatment + pre-treatment DSP protein data, estrogen receptor and PAM50 status. d, ROC and statistical comparison (based on a two-sided t-test) of on-treatment + pre-treatment L2-regularized classifiers trained using DSP protein marker mean values versus bulk RNA expression using RNA transcripts corresponding to the DSP protein markers. ROC curves were generated using cases with DSP pan-CK-enriched data and bulk expression data from both the pre-treatment and on-treatment time points (21 biologically independent cases were used in this analysis). In all panels, the chance (dashed) line is included for reference.