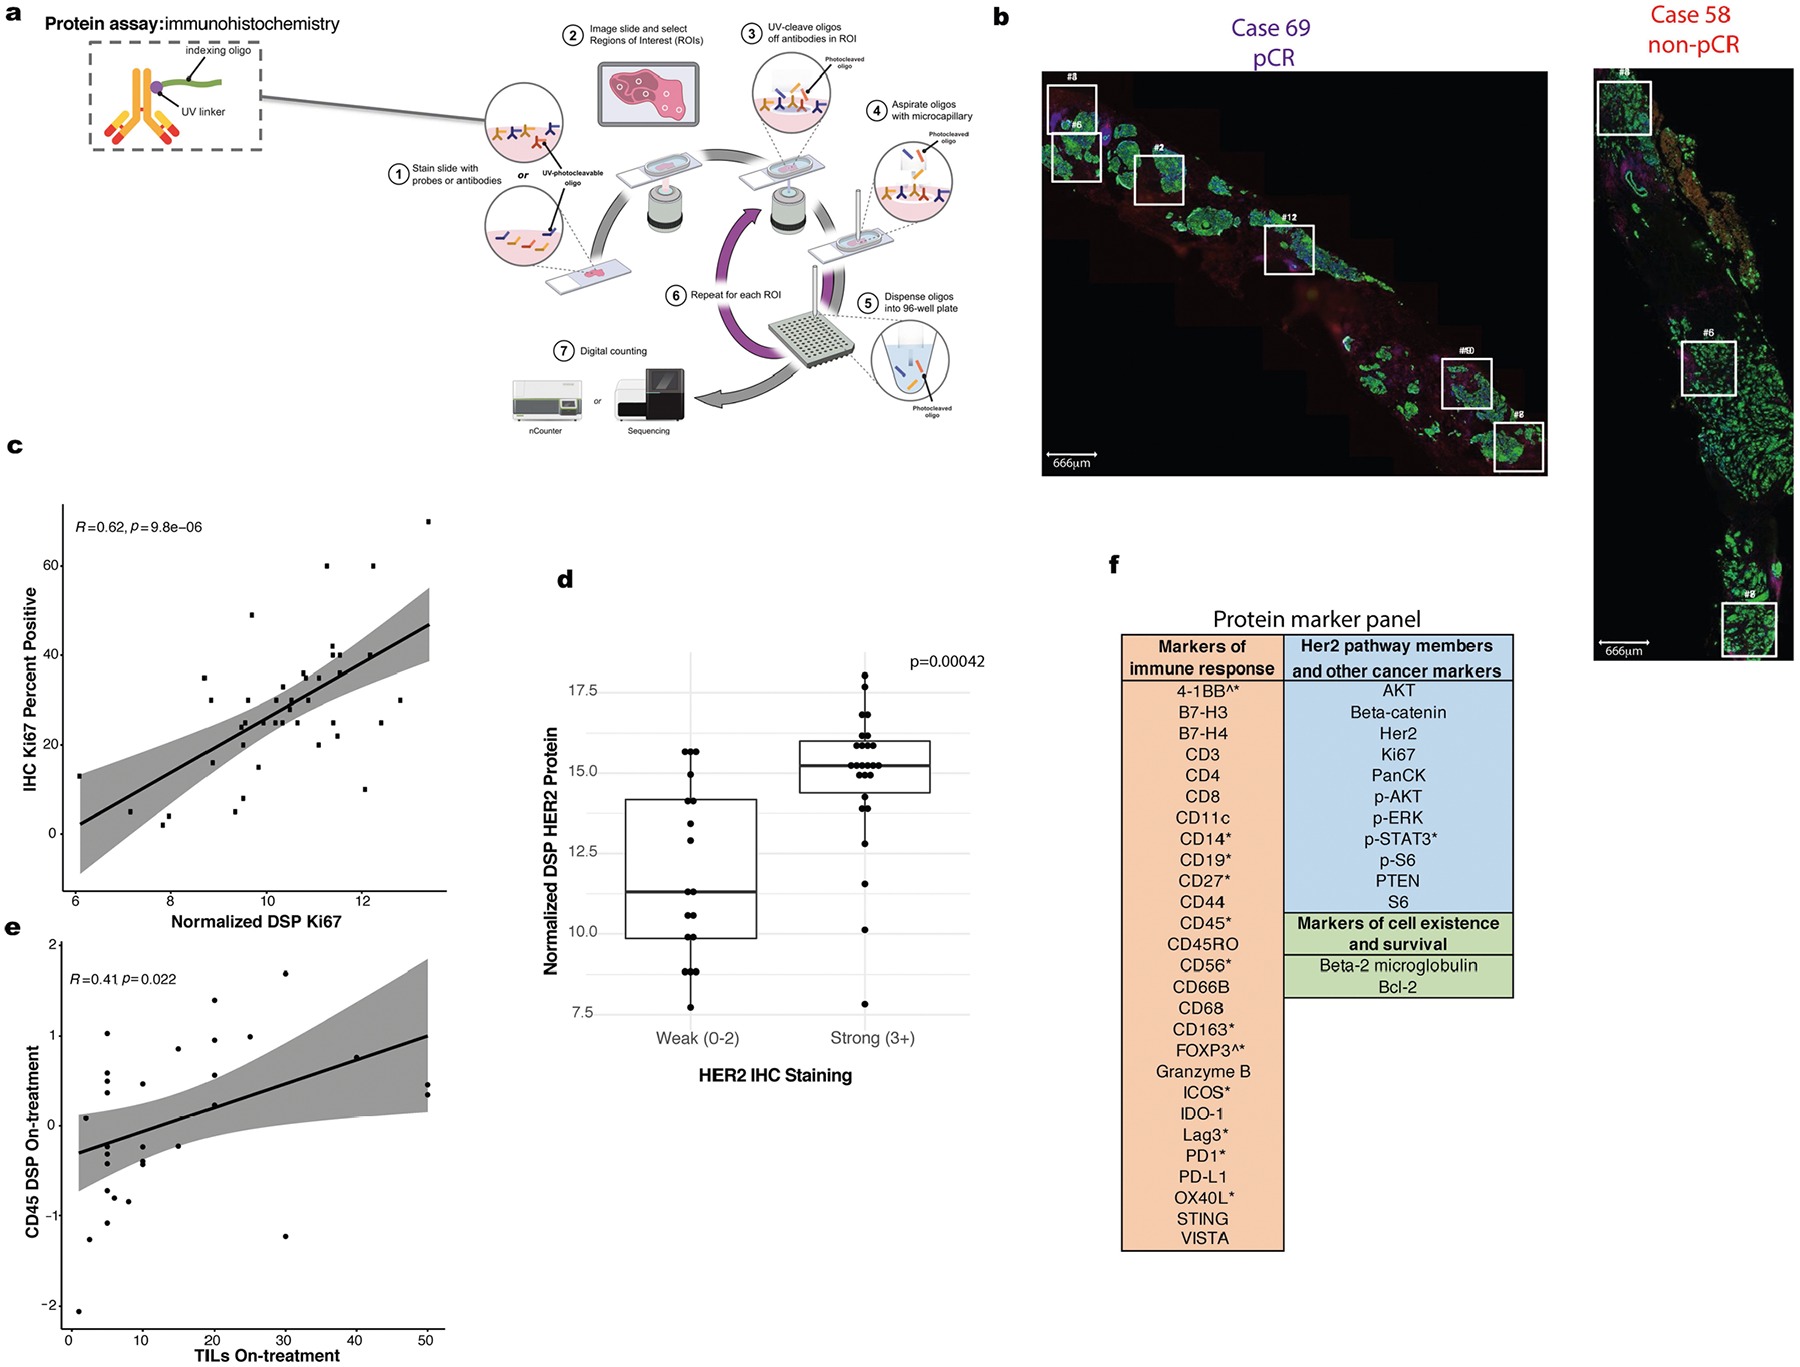
Extended Data Fig. 2 |. Digital Spatial Profiling (DSP) is used for multiplex protein quantification within tumor regions.

a Overview of NanoString DSP workflow adapted with permission from NanoString, Inc. b. Location of spatially separated ROIs within tissue specimens for a representative pCR (69) and non-pCR case (58). An average of 4 ROIs were profiled per tissue (range: 1–7). c. Correlation plot comparing Ki67 percent positive (evaluated using IHC) with normalized DSP Ki67 expression (averaged across ROIs) across n = 42 tumor biopsies (24 pre-treatment, 18 on-treatment). Pearson correlation coefficient and p-value are noted. Grey shading indicates 95% confidence interval (CI) of the correlation coefficient. d. Boxplot comparing normalized DSP Her2 expression (averaged across all ROIs in a given sample) between cases that exhibited strong (3+) IHC Her2 staining (using a distinct tissue slice from the same case and timepoint) or weaker (0–2) IHC Her2 staining. A total of n = 44 biologically independent tumor biopsies (23 pre-treatment, 21 on-treatment) with paired Her2 IHC and DSP data were utilized in this analysis. A two-sided Wilcoxon test was used to assess significance. For each boxplot, the center is the median, the bounds of the box indicate the 25th and 75th percentile, the bounds of the whiskers extend to the most extreme data points that are no more than 1.5x the interquartile range from the bounds of the box; all individual data points, including maxima and minima are overlaid. e. Correlation plot comparing normalized on-treatment CD45 DSP protein values with on-treatment stromal tumor infiltrating lymphocyte (TILs) score for all cases (n = 31) with both data types available. Grey shading indicates the 95% CI of the correlation coefficient. P value is assessed via a one-sided t-test (correlation coefficient not equal to 0). f. Markers with a signal to noise ratio (SNR) < 3 (Methods) in the discovery cohort indicated by a caret (^) and those with SNR < 3 in the validation cohort indicated with an asterisk (*).
