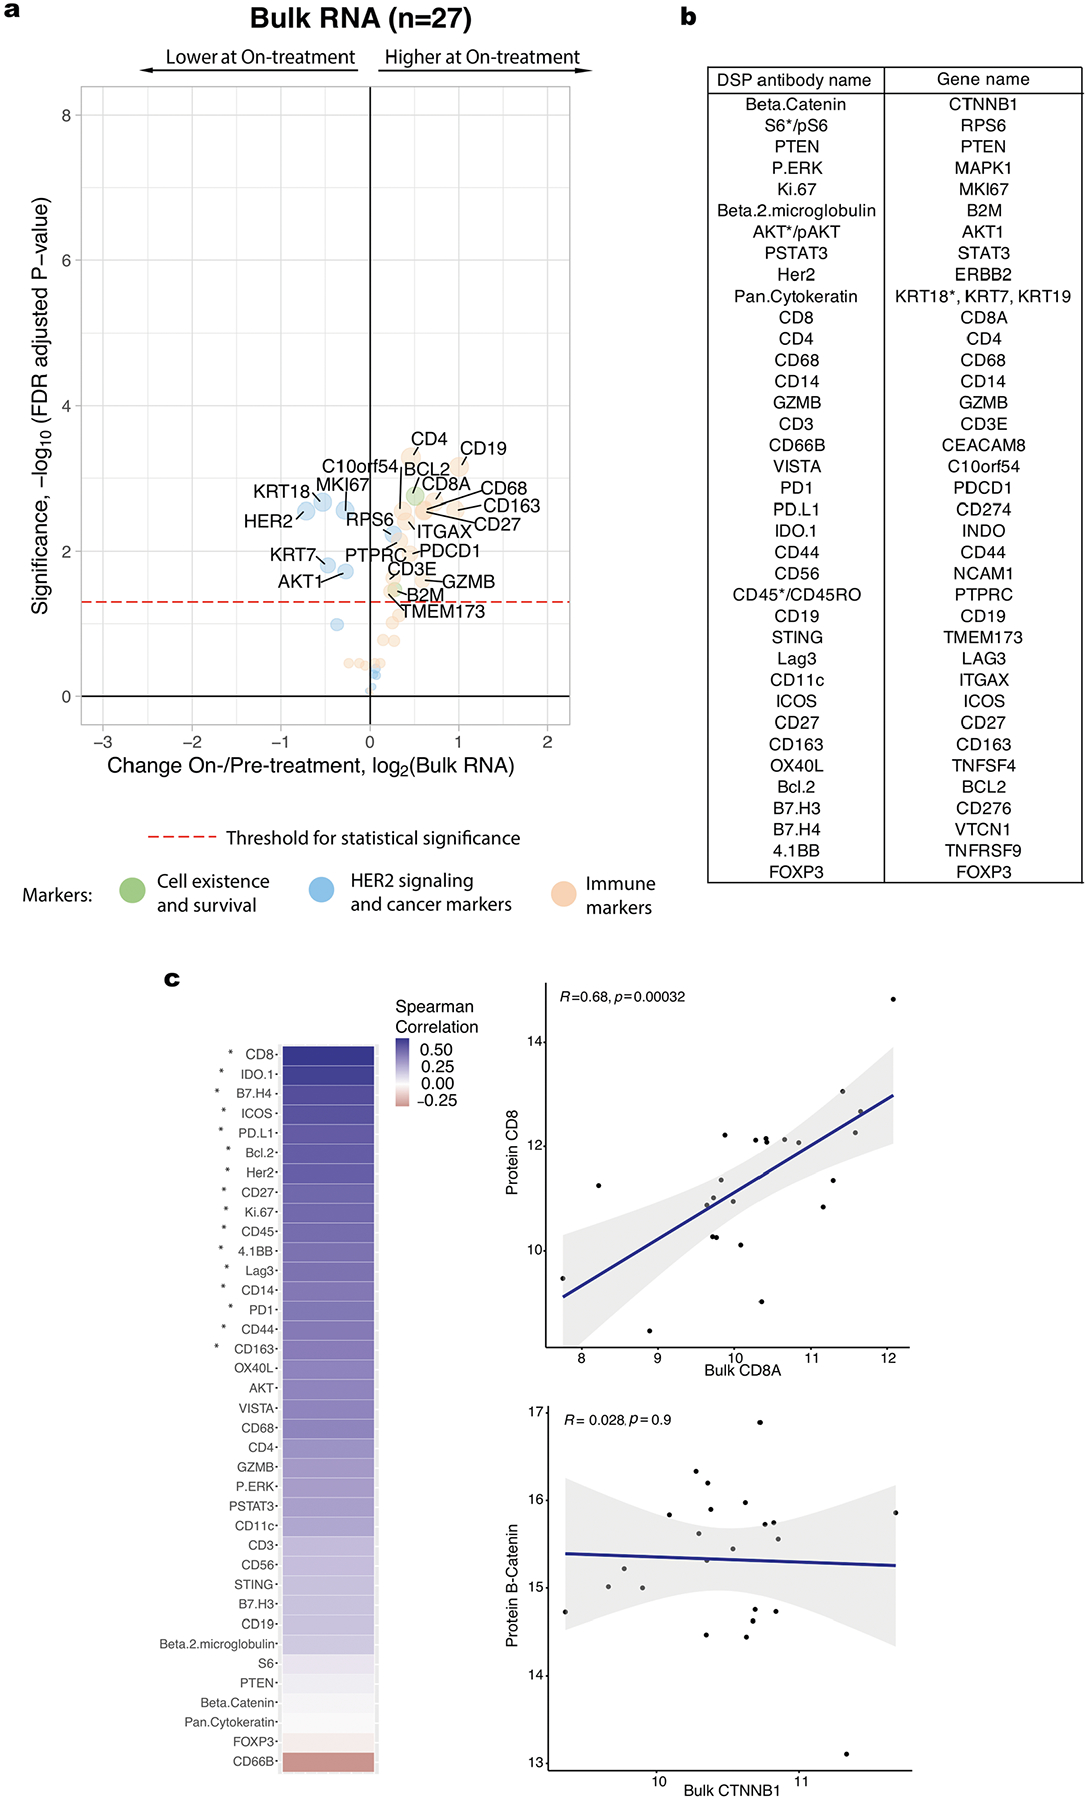
Extended Data Fig. 3 |. Treatment-associated changes observed with bulk RNA data.

a. Volcano plot demonstrating treatment-associated changes based on comparison of pre-treatment versus on-treatment bulk RNA expression levels. RNA transcripts with corresponding Digital Spatial Profiling (DSP) protein markers were used in this analysis. Significance, −log10(FDR adjusted p-value), is indicated along the y-axis. Analyses based on the discovery cohort (n = 28 tumors). b. Pairing of protein antibodies and gene names used in comparative analyses between DSP and bulk expression data. Genes listed here were used to generate the bulk expression volcano plot shown in panel a. For direct comparisons yielding the correlation plots shown in panel c, the marker names indicated by the asterisk were used; specifically, for proteins with multiple form (for example AKT/pAKT, CD45/CD45RO), the unmodified form of the protein was used when available and the breast-cancer associated keratin gene with the highest mean expression level was used. c. Spearman correlation between DSP protein probes (averaged across all ROIs per case) and bulk RNA transcripts corresponding to these markers pre-treatment. Significantly correlated probes (with p-value < 0.05, correlation coefficient not equal to 0, assessed via a one-sided t-test) are indicated by an asterisk. Two exemplary correlation plots are shown, where each dot represents a single case. The grey shading indicates the 95% confidence interval of the correlation coefficient. Analyses based on the discovery cohort cases with paired DSP and bulk RNA data (n = 23 tumors).
