Fig. 2.
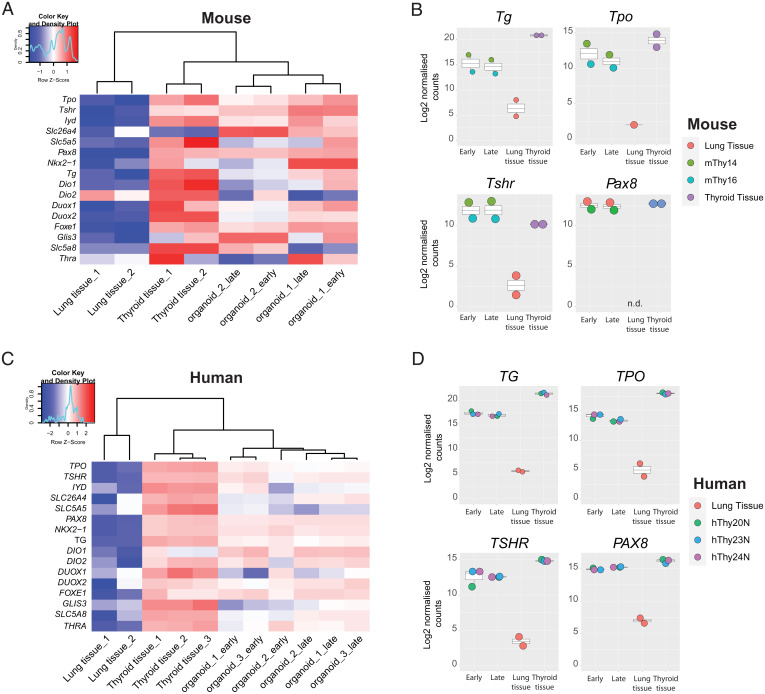
Bulk mRNA sequencing reveals limited differences between late and early passage TFCOs and primary thyroid tissue. (A) Heatmap indicating the expression of thyroid follicular cell markers in mouse primary thyroid tissue, lung tissue, and mouse TFCOs in early and late passages. TFCOs cluster with thyroid tissue in unsupervised hierarchical clustering and apart from lung tissue. Organoid 1 = mThy14, organoid 2 = mThy16. Colored bar represents row z scores of Log2 transformed normalized counts. Density plot indicates the fraction of genes with the given row z score. (B) Boxplots of mouse primary thyroid tissue (thyroid tissue), early passage TFCOs (early), and late passage TFCOs (late) as well as primary lung tissue (lung tissue) Log2 transformed normalized counts of bulk mRNA sequencing. Expression levels of Tg, Tpo, Tshr, and Pax8 are comparable to thyroid tissue. Color of the dots indicates donor visualized as described on the Right. Boxplot shows median, two hinges (25th and 75th percentile), and two whiskers (largest and smallest value no further than 1.5× interquartile range). n.d., not detected. (C) Heatmap indicating the expression of thyroid follicular cell markers in human primary thyroid tissue, lung tissue (GSE148815), and human TFCOs in early and late passages. TFCOs cluster with thyroid tissue in unsupervised hierarchical clustering and apart from lung tissue. Organoid 1 = hThy20N, organoid 2 = hThy23N, and organoid 3 = hThy24N. Colored bar represents row z scores of Log2 transformed normalized counts. Density plot indicates the fraction of genes with the given row z score. (D) Boxplots of human primary thyroid tissue (thyroid tissue), early passage TFCOs (early), and late passage TFCOs (late) as well as primary lung tissue of GSE148815 (lung tissue) Log2 transformed normalized counts of bulk mRNA sequencing. Expression levels of TG, TPO, TSHR, and PAX8 are comparable to thyroid tissue. Color of the dots indicates donor visualized as described on the Right. Boxplot shows median, two hinges (25th and 75th percentile), and two whiskers (largest and smallest value no further than 1.5× interquartile range).

