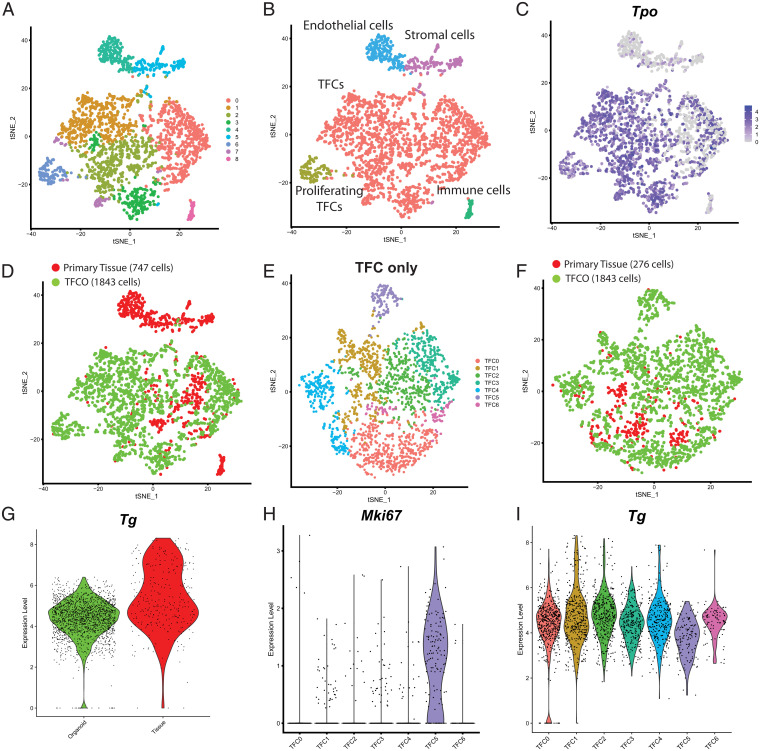
Fig. 3.
Single-cell RNA sequencing of mouse TFCOs and primary tissue reveals limited differences between TFCs except for a proliferative population in organoids. (A) t-distributed stochastic neighbor embedding (tSNE) representation of nine clusters of mouse thyroid tissue cells (n = 747) and mouse TFCO cells (n = 1,843). (B) tSNE representation of five cell types of mouse thyroid tissue cells (n = 747) and mouse TFCO cells (n = 1,843). (C) tSNE representation of the expression of TFC-specific peroxidase Tpo (linear scale). (D) tSNE representation of two origins of mouse thyroid tissue cells (n = 747) and mouse TFCO cells (n = 1,843) visualizing overlap between tissue-derived and TFCO-derived TFCs. (E) tSNE representation of seven clusters of mouse thyroid tissue TFCs (n = 276) and mouse TFCO TFCs (n = 1,843) after reclustering. (F) tSNE representation of two origins of mouse thyroid tissue TFCs (n = 276) and mouse TFCO TFCs (n = 1,843) after reclustering, visualizing the overlap between tissue-derived and TFCO-derived TFCs. (G) Violin plots of the normalized expression level of Tg in TFCOs (“organoid,” n = 1,843 cells) and primary thyroid tissue (“primary tissue,” n = 276 cells) show similarity in expression levels with the exception of some more mature TFCs in thyroid tissue. (H) Violin plots of the normalized expression level of Mki67 in TFC clusters indicates the presence of a proliferative subpopulation of TFCs in cluster TFC5. (I) Violin plots of the normalized expression level of Tg in TFC clusters indicates a less mature population of TFCs in cluster TFC5.

