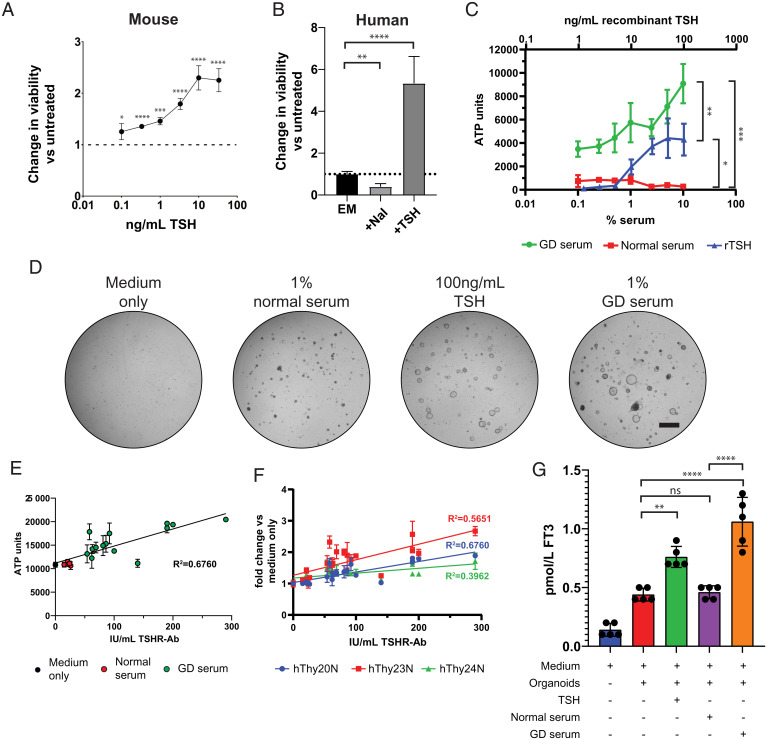
Fig. 6.
TFCOs model Graves’ disease by increased proliferation and hormone secretion after TSHR-Ab stimulation. (A) Addition of TSH increases viability of mouse TFCOs compared to TFCOs cultured without TSH after 7 d. All data points are relative to TFCOs grown in the absence of TSH and FSK. n = 3 per data point. Error bars = SD. *P < 0.05, ***P < 0.001, ****P < 0.0001 using two-way ANOVA with Tukey’s multiple comparisons to untreated samples. (B) Human TFCOs increase viability upon addition of 100 ng/mL TSH (+TSH) as compared to expansion medium (EM) after 7 d. Addition of sodium iodide (NaI) decreases viability of human TFCOs as compared to EM. n = 3. Error bars = SD. **P < 0.01, ****P < 0.0001 using two-way ANOVA with Tukey’s multiple comparisons. (C) Increased viability is observed in human TFCOs when cultured for 10 d with 10 to 100 ng/mL recombinant (rTSH) (Upper axis) compared to untreated TFCOs. More extensive increase in viability is observed when TFCOs are cultured for 10 d with serum of Graves’ disease patients (TSHR-Ab >3.3 IU/L) (Lower axis). Incubation with normal serum (TSHR-Ab <3.3 IU/L) did not show increased viability of TFCOs even when using 10% serum (Lower axis). n = 3. Error bars = SD. *P < 0.05, **P < 0.01, ***P < 0.001 using two-way ANOVA with Tukey’s multiple comparisons. (D) Representative brightfield images show limited outgrowth in expansion medium without FSK (medium only) and 1% normal serum (TSHR-Ab <3.3 IU/L) after 10 d. Increased outgrowth is visible in cultures grown with 100 ng/mL TSH after 10 d. More extensive outgrowth and organoid size is observed in cultures grown in 1% GD serum (TSHR-Ab >3.3 IU/L). (Scale bar, 1 mm.) (E) Incubation of TFCOs with 1% serum with varying TSHR-Ab titers reveals correlation between TFCO growth and TSHR-Ab titers. Each dot represents a single serum tested in triplicate. Color of the dots indicate category of serum being medium only (black), normal serum (TSHR-Ab <3.3 IU/L) (red), or GD serum (TSHR-Ab >3.3 IU/L) (green). n = 3 per data point. Error bars = SD. R2 using Pearson correlation. (F) Comparison between three different donors (indicated in different colors) in a similar assay as in E shows correlation of TSHR-Ab titers and TFCO growth in all donors still with variable slopes. n = 3 per data point. Error bars = SD. R2 using Pearson correlation. (G) Stimulation with 100 ng/mL recombinant TSH or 1% GD serum (TSHR-Ab >3.3 IU/L) increases free T3 (FT3) levels in conditioned medium of human TFCOs after 48 h. No significant increase in FT3 levels is observed when TFCOs are stimulated with 1% normal serum (TSHR-Ab <3.3 IU/L) compared to medium in combination with organoids. Each dot represents a separate expanded well of organoids measured. n = 5. Error bars = SD. ns, not significant, **P < 0.01, ****P < 0.0001 using two-way ANOVA with Tukey’s multiple comparisons.

