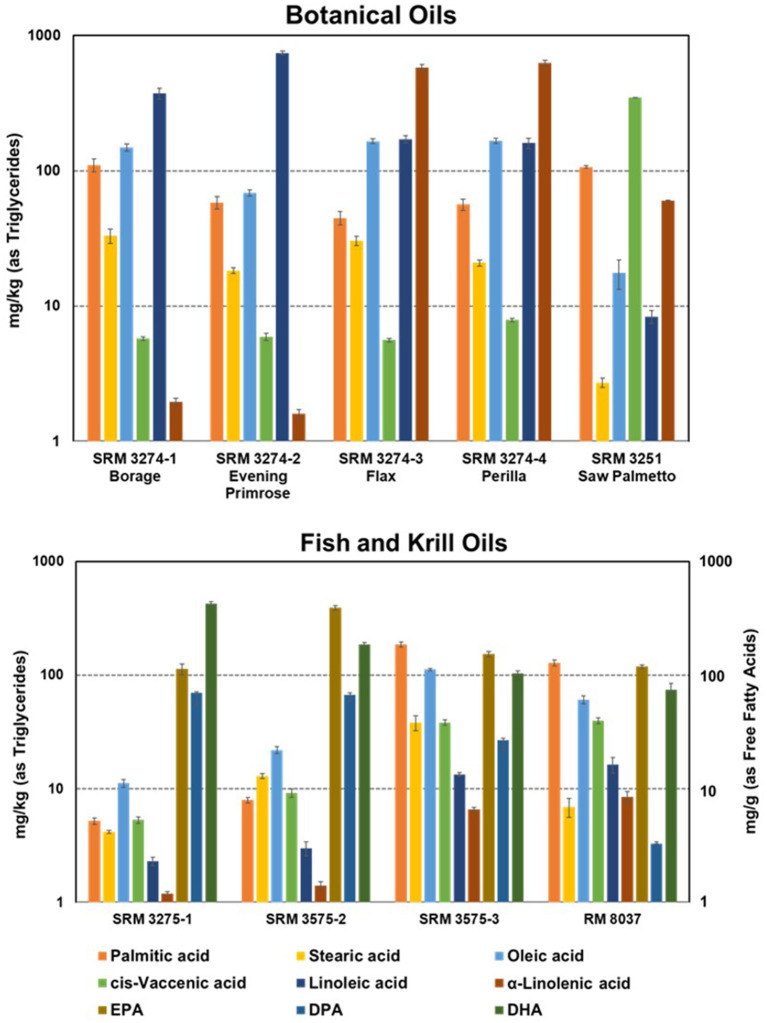
Figure 4.
Bar graphs of the distribution of mass fractions of selected fatty acids (as triglycerides) in marine and botanical oil SRMs and RMs. Note the logarithmic scale for the mass fractions, and for NIST RM 8037 Krill Oil the units are mg/g (as free fatty acids). Error bars are the expanded uncertainties of the certified and reference values with 95% confidence. Adapted and reprinted with permission from Springer, Anal. Bioanal.Chem., Wise and Phillips (75).

