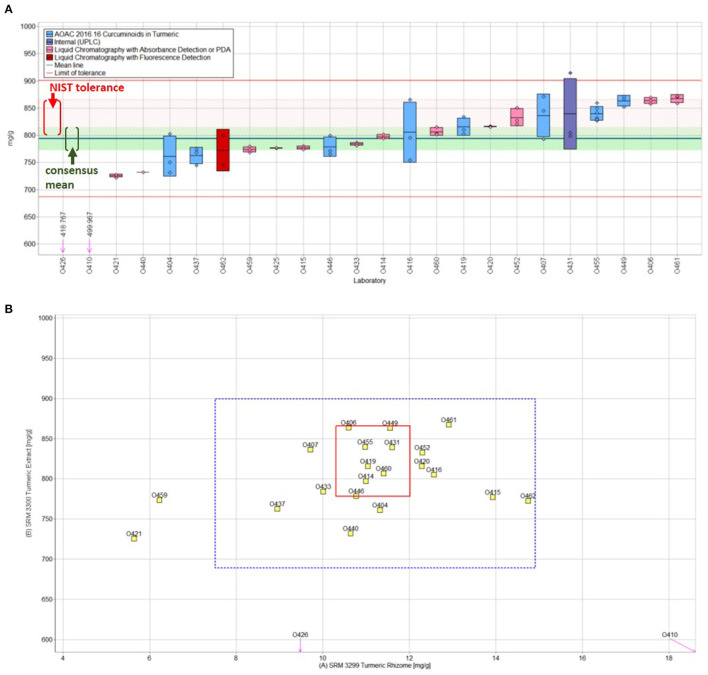
Figure 6.
(A) Curcumin (ng/g) in NIST SRM 3300 Turmeric (C. longa L.) Rhizome Extract. Individual laboratory data are plotted (circles) with standard deviation (n = 3, rectangle) in order of increasing magnitude. The color of the data rectangle indicates the analytical method employed. The solid blue line is the consensus mean, and the green shaded region represents the 95% confidence interval for the consensus mean. The solid red lines represent the consensus range of tolerance calculated as the values above and below the consensus mean that result in an acceptable Z'comm score. The red shaded region represents the NIST range of tolerance, which encompasses the NIST-determined value bounded by twice its uncertainty and represents the range that results in an acceptable Z'NIST score. (B) Laboratory means for curcumin in NIST SRM 3299 Turmeric Rhizome and SRM 3300. The laboratory mean for the turmeric rhizome is compared to the mean of the extract for each laboratory. The solid red box represents the NIST range of tolerance for the two turmeric SRMs, rhizome (x-axis) and extract (y-axis), as the dotted blue box represents the consensus range of tolerance described for (A). For a detailed discussion of the statistical treatment of the results, see Barber et al. (110). Adapted with permission from Barber et al., NISTIR 8266, 2019.

