Fig. 2.
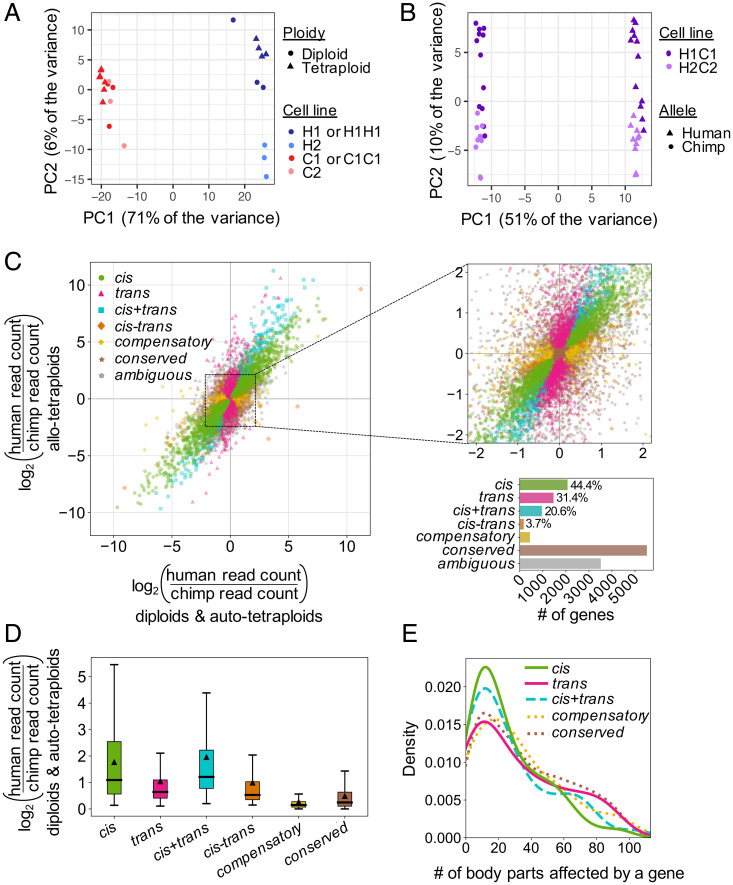
Gene expression profiling of human and chimpanzee diploid, autotetraploid, and allotetraploid iPSC lines. Tetraploidization does not result in coordinated gene expression changes, but thousands of genes are expressed differently between human and chimpanzee iPSCs due to a mixture of cis- and trans-regulatory changes. (A) Principal component analysis (PCA) of RNAseq of H1, H2, C1, C2, H1H1, and C1C1 diploid and autotetraploid iPSC lines. The cell lines cluster by species along PC1 and by cell line along PC2. Autotetraploid lines cluster with their cognate diploid line. (B) PCA of RNAseq of H1C1 and H2C2 allotetraploid lines. Allotetraploid lines are each represented by two dots, one for reads mapping to the human transcriptome and one for reads mapping to the chimpanzee transcriptome (Materials and Methods). Expression from human alleles (triangles) cluster separately from chimpanzee alleles (circles) in allotetraploid lines along PC1. PC2 separates the two sets of allotetraploid cell lines. (C) Each gene’s expression pattern was classified by regulatory type (cis, trans, cis+trans, cis–trans, compensatory, conserved, or ambiguous) by comparing DE between human- and chimpanzee-only iPSCs (x axis) and allele-specific gene expression between human and chimpanzee alleles within allotetraploid iPSCs (y axis). (Left) Data for all genes. (Upper Right) Zoom-in of dense center region. (Lower Right) Bar graph indicating number of genes per category and relative contribution (percentage) of each category to genes with human–chimpanzee regulatory differences. (D) Box plot showing distribution of effect sizes for gene expression changes in each regulatory category. Median effect size is indicated by thick horizontal lines, and mean effect size is indicated by triangles. All pairwise comparisons are statistically significant (adjusted P < 0.012 by two-tailed Mann–Whitney U test). (E) Density plot (smoothed histogram) showing the distribution of body parts influenced by genes [according to the Gene ORGANizer database (20)] in each regulatory category. For genes classified as cis, trans, and cis+trans, only genes with are plotted. The cis–trans category is not included because only five genes have . Note that genes classified as cis or cis+trans tend to influence fewer body parts than conserved genes (median 18 body parts for both cis and cis+trans genes compared to median 30 body parts for conserved genes, adjusted P = 0.00028 and P = 0.0035 by two-tailed Mann–Whitney U test after FDR correction). This trend is not observed for trans and compensatory regulatory types (median 24 and 27 body parts, adjusted P = 0.11 and P = 0.21, respectively).

