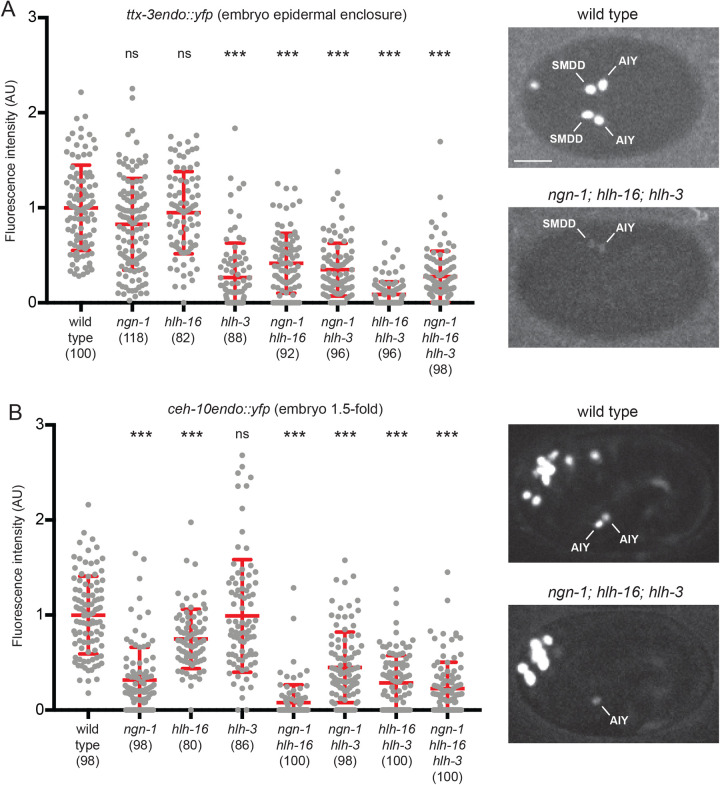
Fig. 4.
Effect of combinations of bHLH mutants on the initiation of ttx-3 and ceh-10 expression in the embryo. (A) Graph: quantification of the fluorescence levels of ttx-3endo::yfp (vba3) in AIY neurons at epidermal enclosure embryonic stage in wild type or combinations of bHLH mutants. Each grey dot represents one neuron. The number of neurons analyzed is presented below the genotype. Red bars represent mean and s.d., Mann–Whitney test with Bonferroni correction for multiple comparisons (ns: not significant, ***P<0.001). Please note that, in ngn-1 single mutants, only a decrease of ttx-3endo::yfp expression intensity is observed (but no complete loss) at epidermal enclosure stage; these data are consistent with the observation of no complete loss of ttx-3pB::gfp expression at epidermal enclosure stage reported in Fig. 1C. Pictures: expression of ttx-3endo::yfp (vba3) at epidermal enclosure embryonic stage. The wild-type embryo shows strong expression in the two SMDD and AIY neurons. The ngn-1; hlh-16; hlh-3 triple mutant embryo shows weak expression in one SMDD and AIY, and no expression in the other SMDD and AIY. Ventral view, anterior is left, scale bar: 10 µm. (B) Graph: quantification of the fluorescence levels of ceh-10endo::yfp (vba1) in AIY neurons at 1.5-fold embryonic stage in wild type or combinations of bHLH mutants. Pictures: expression of ceh-10endo::yfp (vba1) at 1.5-fold embryonic stage. The wild-type embryo shows strong expression in the two AIY neurons. The ngn-1; hlh-16; hlh-3 triple mutant embryo shows weaker expression in one AIY, and no expression in the other. Lateral view, anterior is left, dorsal is up.

