
Fig. 5.
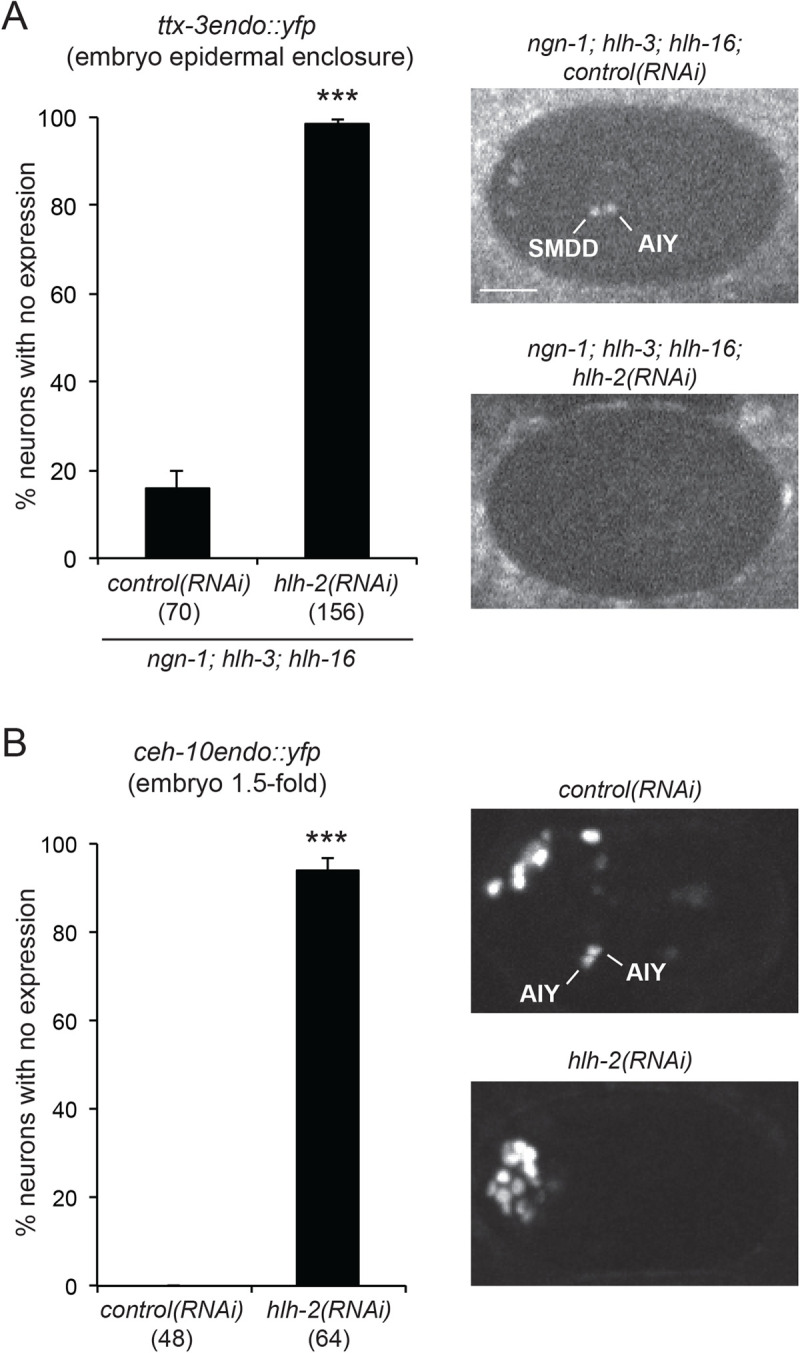
Effect of hlh-2 on the initiation of ttx-3 and ceh-10 expression in the embryo. (A) Graph: percentage of AIY neurons with no expression of ttx-3endo::yfp (vba3) in ngn-1(ok2200); hlh-16(ot711); hlh-3(tm1688) triple mutants treated with control(RNAi) or hlh-2(RNAi). Embryos at epidermal enclosure stage; error bars show standard error of proportion; numbers below genotypes show numbers of neurons analyzed; Fisher's exact test (***P<0.001). Pictures: expression of ttx-3endo::yfp (vba3) at epidermal enclosure embryonic stage. The ngn-1; hlh-16; hlh-3 triple mutant embryo treated with control(RNAi) shows weak expression in one SMDD and AIY, and no expression in the other SMDD and AIY. The ngn-1; hlh-16; hlh-3 triple mutant embryo treated with hlh-2(RNAi) shows no expression in SMDD or AIY. Ventral view, anterior is left, scale bar: 10 µm. (B) Graph: percentage of AIY neurons with no expression of ceh-10endo::yfp (vba1) after treatment with control(RNAi) or hlh-2(RNAi). To increase RNAi efficiency, the animals contain the rrf-3(pk1426) mutation. Embryos at 1.5-fold stage; error bars show standard error of proportion; numbers below genotypes show numbers of neurons analyzed; Fisher's exact test (***P<0.001). Pictures: expression of ceh-10endo::yfp (vba1) at 1.5-fold embryonic stage. The embryo treated with control(RNAi) shows strong expression in the two AIY neurons. The embryo treated with hlh-2(RNAi) shows no expression in AIY. Lateral view, anterior is left, dorsal is up.