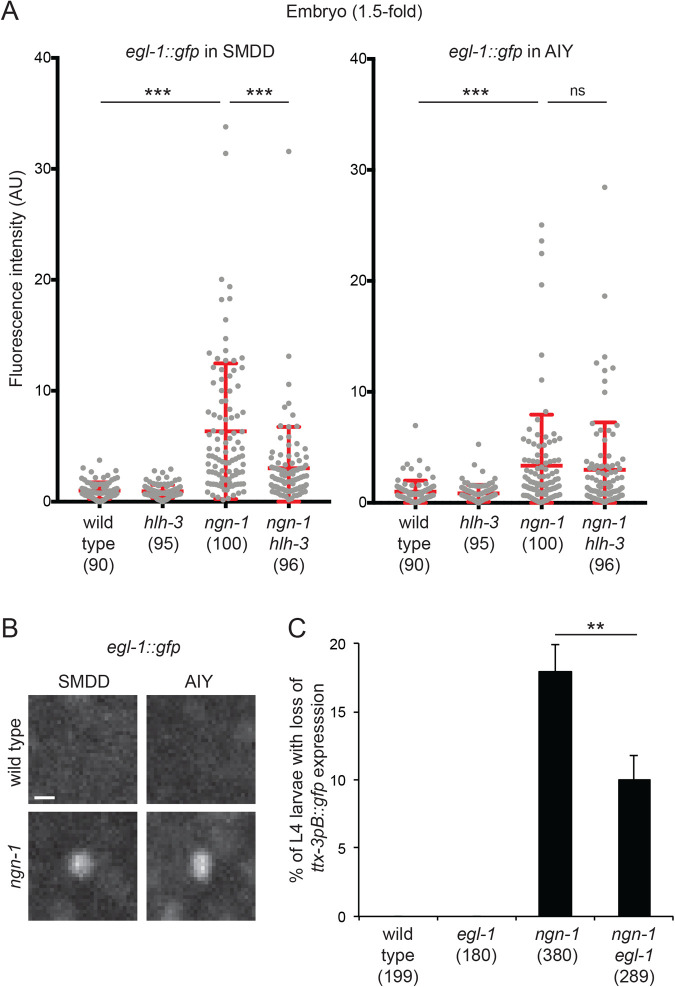
Fig. 7.
Interaction between ngn-1 and egl-1. (A) Quantification of egl-1::gfp (bcIs37) expression in SMDD and AIY neurons at 1.5-fold embryonic stage in wild type or combinations of ngn-1(ok2200) and hlh-3(tm1688) mutants. Each grey dot represents one neuron. The number of neurons analyzed is presented below the genotype. Red bars represent mean and s.d.; Mann–Whitney test with Bonferroni correction for multiple comparisons (ns, not significant; ***P<0.001). (B) Pictures of egl-1::gfp (bcIs37) expression in SMDD and AIY neurons at 1.5-fold embryonic stage in wild type or ngn-1(ok2200) mutants; scale bar: 2 µm. (C) Percentage of L4 larvae with loss of ttx-3pB::gfp (otIs173) expression in at least one AIY neuron, in wild type or combinations of ngn-1(ok2200) and egl-1(n1084n3082) mutants. Error bars show standard error of proportion; numbers below the genotypes show numbers of animals analyzed; **P<0.01, Fisher's exact test.

