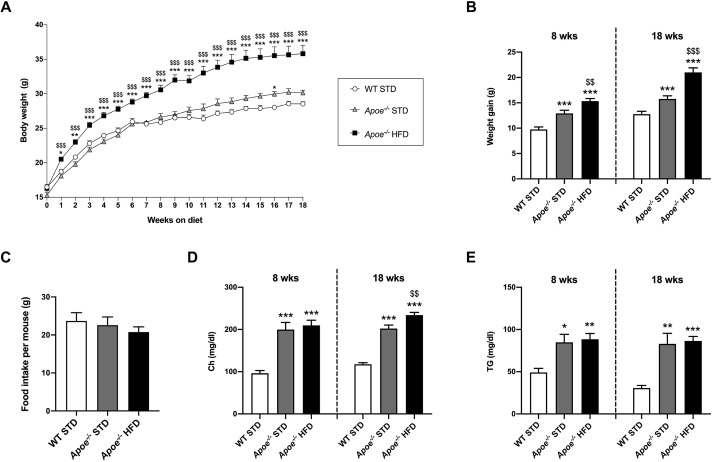
Fig. 1.
Characterization of obesity and lipid profile in the mouse model of NAFLD. (A) Graph showing BW progression in STD-fed WT (WT STD; n=20-39), STD-fed Apoe−/− (Apoe−/− STD; n=10-37) and HFD-fed Apoe−/− (Apoe−/− HFD; n=18-38) mice from weaning until the 18th week on the diet. (B) Representation of BW gain from weaning to 8 or 18 weeks of diet in the three experimental groups. (C) Assessment of food intake per mouse and per week (g) in WT STD (n=16), Apoe−/− STD (n=23) and Apoe−/− HFD (n=27) mice. (D) Levels of plasma Ch (mg/dl) in WT STD (n=6-7), Apoe−/− STD (n=5-9) and Apoe−/− HFD (n=8-10) mice after 8 or 18 weeks on the diet. (E) Circulating TG levels (mg/dl) in WT STD (n=7), Apoe−/− STD (n=4-9) and Apoe−/− HFD (n=8-10) mice after 8 or 18 weeks on the diet. Results are expressed as mean±s.e.m. Statistical significance was assessed by two-tailed unpaired Student's t-test, except for TGs at 8 weeks of diet, which were evaluated by unpaired non-parametric Mann–Whitney U test. *P<0.05, **P<0.01 and ***P<0.001 versus WT STD mice; $$P<0.01 and $$$P<0.001 versus Apoe−/− STD mice. BW, body weight; Ch, cholesterol; HFD, high-fat diet; STD, standard diet; TG, triglycerides; WT, wild type.

