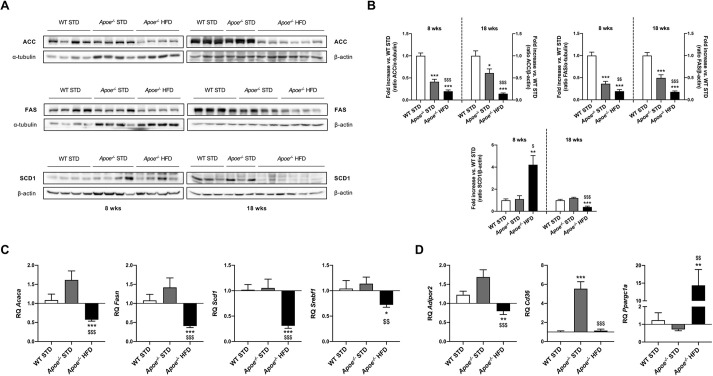
Fig. 3.
Expression of pivotal proteins and mRNA levels of genes involved in hepatic lipid metabolism. (A) Representative western blot analysis of ACC, FAS and SCD1 in liver homogenates from the six groups studied. α-tubulin or β-actin was used as a loading control. (B) Histograms presenting the protein/α-tubulin or β-actin ratio quantifications of band intensities in WT STD (n=3-4), Apoe−/− STD (n=3-4) and Apoe−/− HFD (n=4-6) mice after 8 or 18 weeks on the diet. (C) mRNA levels of Acaca, Fasn, Scd1 and Srebf1 by RT-qPCR in livers from WT STD (n=5-7), Apoe−/− STD (n=5-8) and Apoe−/− HFD (n=9-14) mice after 18 weeks on the diet. Actb was used as a control. (D) mRNA levels of Adipor2, Cd36 and Ppargc1a by RT-qPCR in livers from WT STD (n=4-5), Apoe−/− STD (n=4-5) and Apoe−/− HFD (n=7-9) mice after 18 weeks on the diet. Actb was used as a control. Results are expressed as mean±s.e.m. Statistical significance was assessed by two-tailed unpaired Student's t-test, apart from ACC, 8-week-diet FAS and 18-week-diet SCD1 data, and mRNA levels of Cd36 and Ppargc1a, which were evaluated by unpaired non-parametric Mann–Whitney U test. *P<0.05, **P<0.01 and ***P<0.001 versus WT STD mice; $P<0.05, $$P<0.01 and $$$P<0.001 versus Apoe−/− STD mice.

