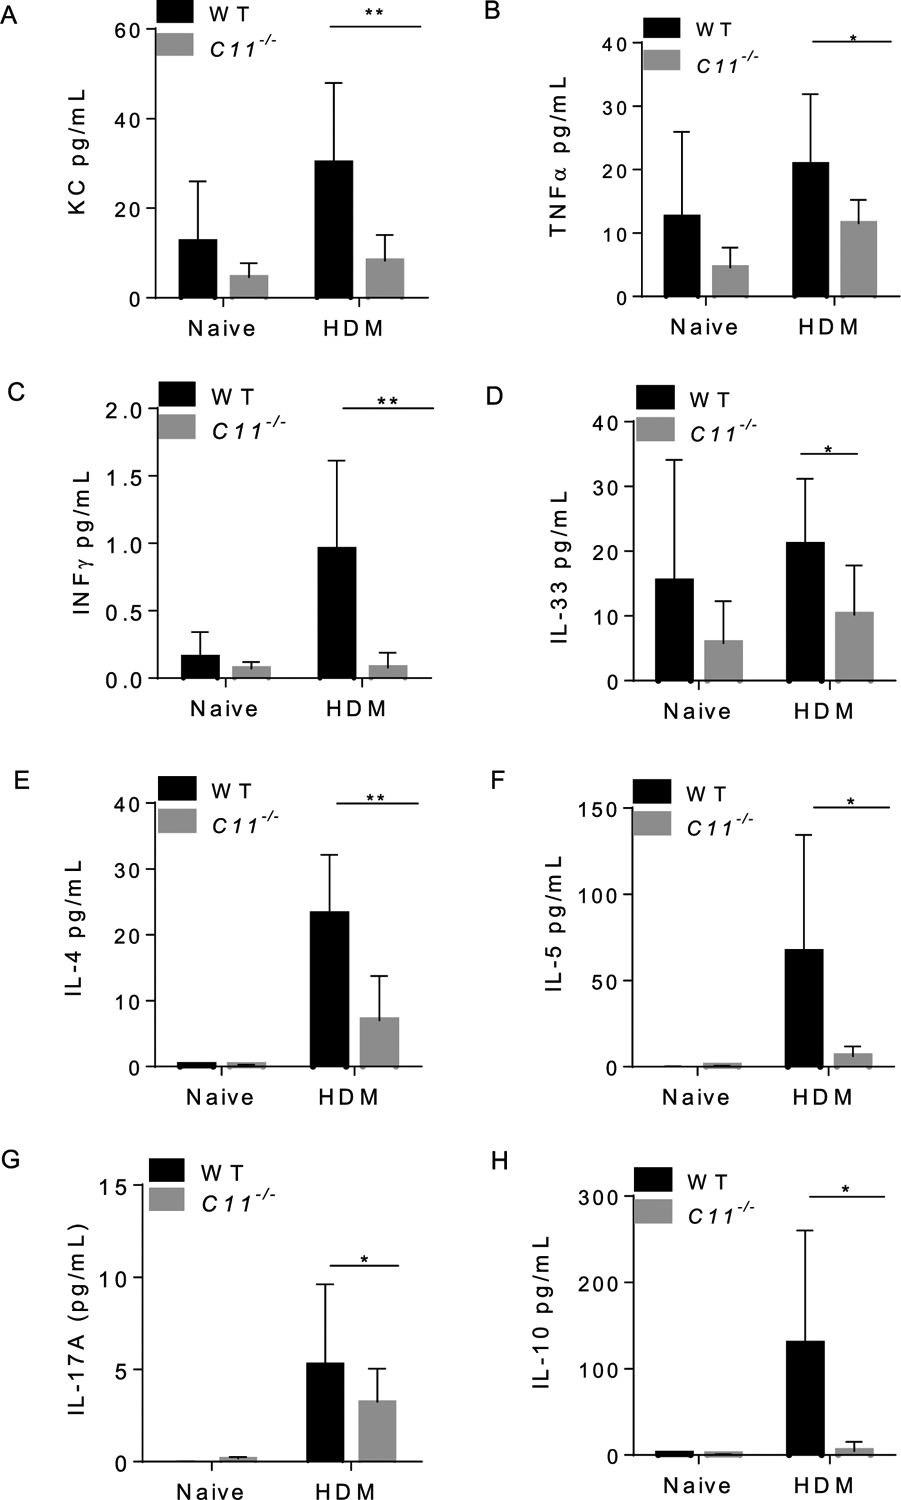
Fig. 6. BALF from caspase-11−/− mice show differential levels of Th1 and Th2 cytokines compared to WT.

BALF samples were obtained from mice on day 35 post HDM challenge. Levels of BALF cytokines were quantified by multiplex MSD electro-chemiluminescence (OSU core facility). Day 0 represents serum obtained from naïve animals, while day 35 represents serum obtained from animals exposed to HDM for 35 days. KC (A), TNFα (B), IFNγ (C), IL-33 (D), IL-4 level (E), IL-5 (F), IL-17A (G), IL-10 level (H). Data represent the mean ± SD (n = 4) per group obtained from the second in vivo experiment. Multiple t tests performed for statistical analysis, * P < 0.05, ** p < 0.01.
