Fig. 3.
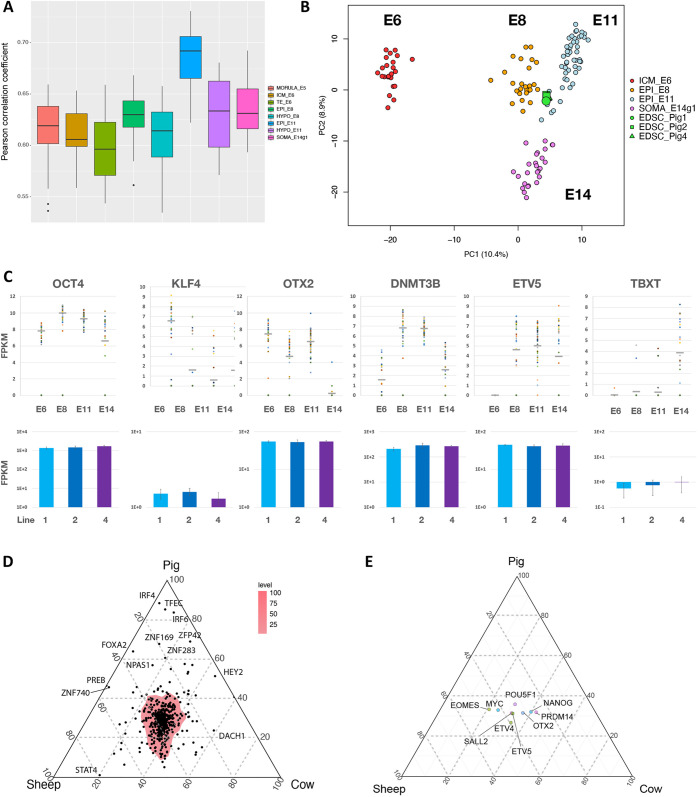
Transcriptome analysis of embryonic disc stem cells. (A) Pearson correlation of pig EDSC transcriptome with porcine embryo stages (Ramos-Ibeas et al., 2019; Zhu et al., 2021). For E14, we used the g1 population of posterior cells that are mostly OCT4 positive. The box extends from the lower to the upper quartile and the horizontal line is the median. Whiskers extend to 1.5 times the interquartile range. (B) Projection of porcine EDSCs on PCA of porcine embryo stages computed using the top 1000 variable genes. (C) Expression values of selected marker genes in porcine and EDSCs. Upper: embryo scRNAseq FPKM values with median marked by horizontal bar. Lower: cell line RNAseq log FPKM values. Error bars represent s.d. from triplicate samples. (D) Ternary plot for EDSCs of the three species computed for 555 orthologous transcription factor genes expressed in porcine E11 epiblast. The region of highest density of shared factors is shaded. Differentially expressed genes are indicated. (E) Ternary plot as in D, with selected pluripotency-associated factors labelled.

