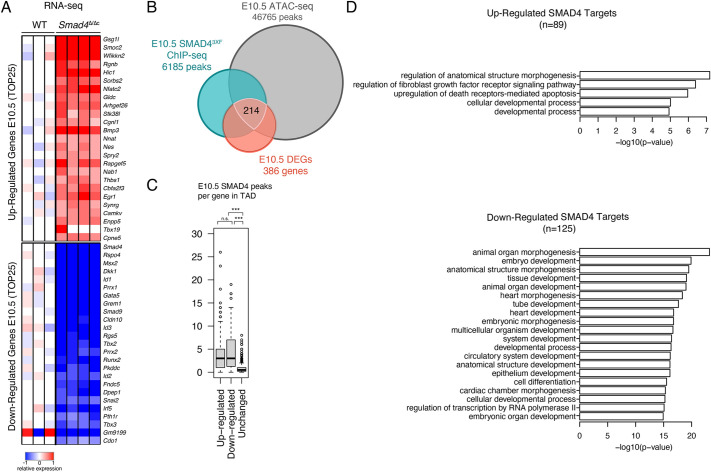
Fig. 3.
The SMAD4 target genes in mouse forelimb buds at E10.5. (A) Heatmaps showing the DEGs identified by comparing wild-type (WT) and Smad4Δ/Δc transcriptomes at E10.5 (35 somites; wild type, n=3; Smad4Δ/Δc, n=4 biological replicates). The top 25 downregulated and upregulated genes are shown (normalized to the mean expression in wild-type samples). For each gene, the log2-ratio between the expression levels in each sample and the mean of the wild-type forelimb buds is shown. (B) Three-way Venn diagram showing the intersection between the ChIP-seq (E10.5, 34-38 somites), ATAC-seq (E10.5, 35 somites) and RNA-seq (E10.5, 35 somites) datasets. This intersection identifies 214 candidate SMAD4 target genes in forelimb buds. (C) Box plot analysis representing the number of SMAD43xF ChIP-seq peaks within a TAD harboring the SMAD4 target gene. The box plot indicates median (50th percentile) and interquartile range (25th and 75th percentiles; IQR) with whiskers set at 1.5×IQR. Values exceeding the whiskers are considered outliers and are individually marked. Upregulated versus unchanged, P=1.5e-52; downregulated versus unchanged, P=1.4e-36 (Mann–Whitney test). n.s., not significant. (D) GO enrichment analysis of biological processes for down- and upregulated SMAD4 target genes.

