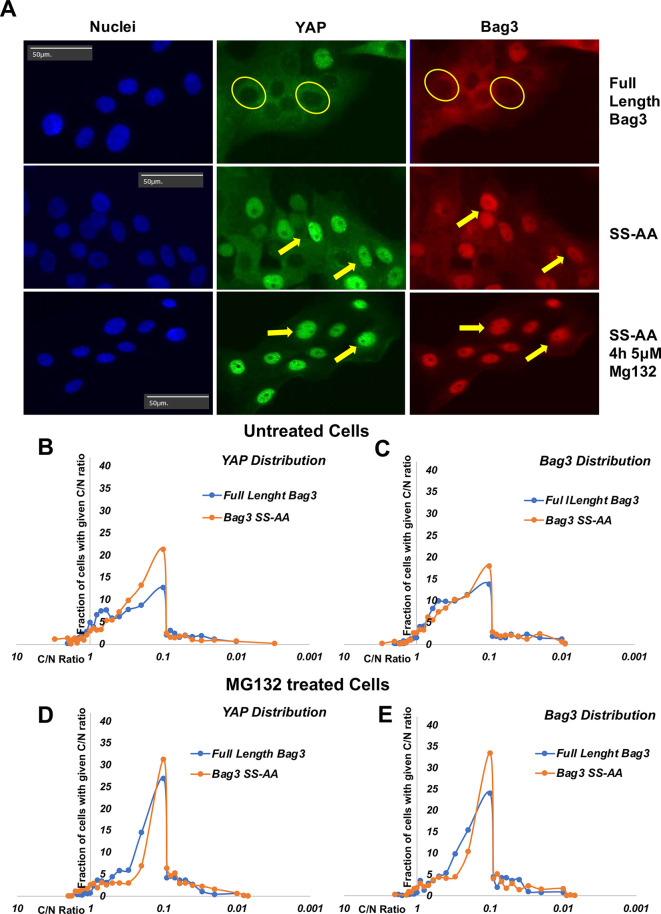
Fig. 6.
Distribution of cells in the population according to C/N ratio of YAP and SS→AA Bag3. (A) Representative image of localization of YAP and Bag3 in the presence and absence of MG132. Arrows indicate nuclei with high content of either YAP or Bag3. Circles indicate nuclei with low content of YAP or Bag3. Images are representative of three experiments. (B) Distribution of cells in the population according to C/N ratio of YAP in naïve cells. (C) Distribution of cells in the population according to C/N ratio (cytoplasmic/nuclear localization) of SS→AA Bag3 in naïve cells. (D) Distribution of cells in the population according to C/N ratio of YAP in cells treated with MG132 (4 h, 5 μM). (E) Distribution of cells in the population according to C/N ratio of SS→AA Bag3 in cells treated with MG132 (4 h, 5 μM). A control for mutant SS-AA Bag3 and P209L Bag3 expression is shown in Fig. S2.

