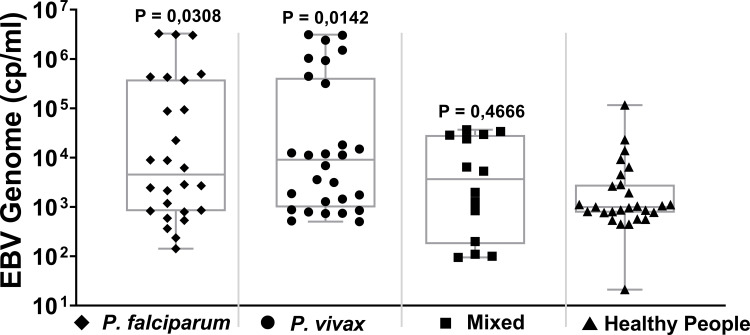
Fig 2. Quantitative EBV-DNA genome levels (copies/ml) in blood plasma in 3 groups of Malaria cases (P. falciparum, P. vivax and Mixed) and regional controls.
Box-limits represent the 95% confidence interval and the line represents the median level of EBV-DNA. Statistical analysis was done by one-Way ANOVA (cases versus controls).

