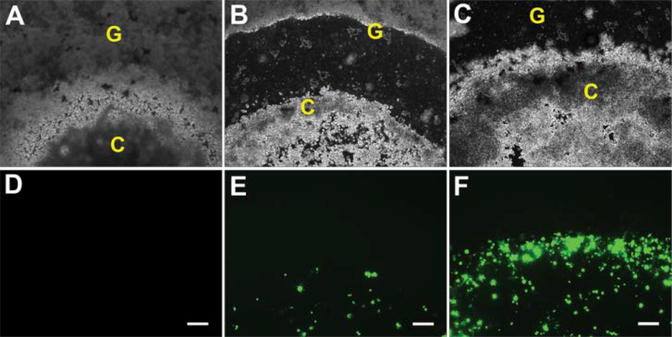
Figure 6.
GFP expression by transfected N2A cells in 3.5% T904/2% FgN hydrogels in 2D model. Transfected cells were visualized at 1 day (A,D), 3 days (B,E), and 7 days (C,F) with phase contrast (A-C) and fluorescence microscopy (D-E). Original magnifications, 200X. Scale bar represents 200 μm.
C: Fibrin cluster, G: 3.5% T904/2% FgN hydrogels (3 μg pGFP/gel).

