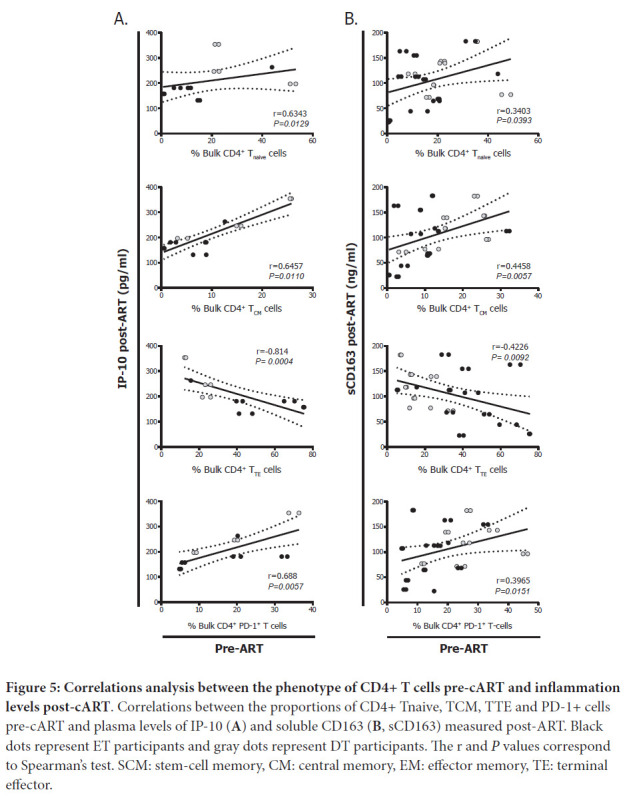
Figure 5:

Correlations analysis between the phenotype of CD4+ T cells pre-cART and inflammation levels post-cART. Correlations between the proportions of CD4+ Tnaive, TCM, TTE and PD-1+ cells pre-cART and plasma levels of IP-10 (A) and soluble CD163 (B, sCD163) measured post-ART. Black dots represent ET participants and gray dots represent DT participants. The r and P values correspond to Spearman's test. SCM: stem-cell memory, CM: central memory, EM: effector memory, TE: terminal effector.
